Contact Us
Back to Blog

Rajeev Shrivastava

CHIEF EXECUTIVE OFFICER

Rajeev brings extensive leadership experience from top technology companies. Previously, he drove significant growth and innovation at Google and NICE inContact, leading major strategic initiatives and successful mergers. His expertise in scaling businesses and fostering innovation is underpinned by an MBA from the Wharton School and a Bachelor’s degree from Delhi College of Engineering. Prior to joining TigerGraph, Rajeev was at Google, where he served as GM & Product Lead for an AI-first Customer Conversation Platform. In this role, he managed a significant P&L and led teams driving innovation and growth within Google’s expansive business landscape. Previously, Rajeev played a pivotal role in the growth of NICE inContact as their Chief Product & Strategy Officer. Prior to NICE inContact, Rajeev led go-to-market and marketplace initiatives at Rackspace.

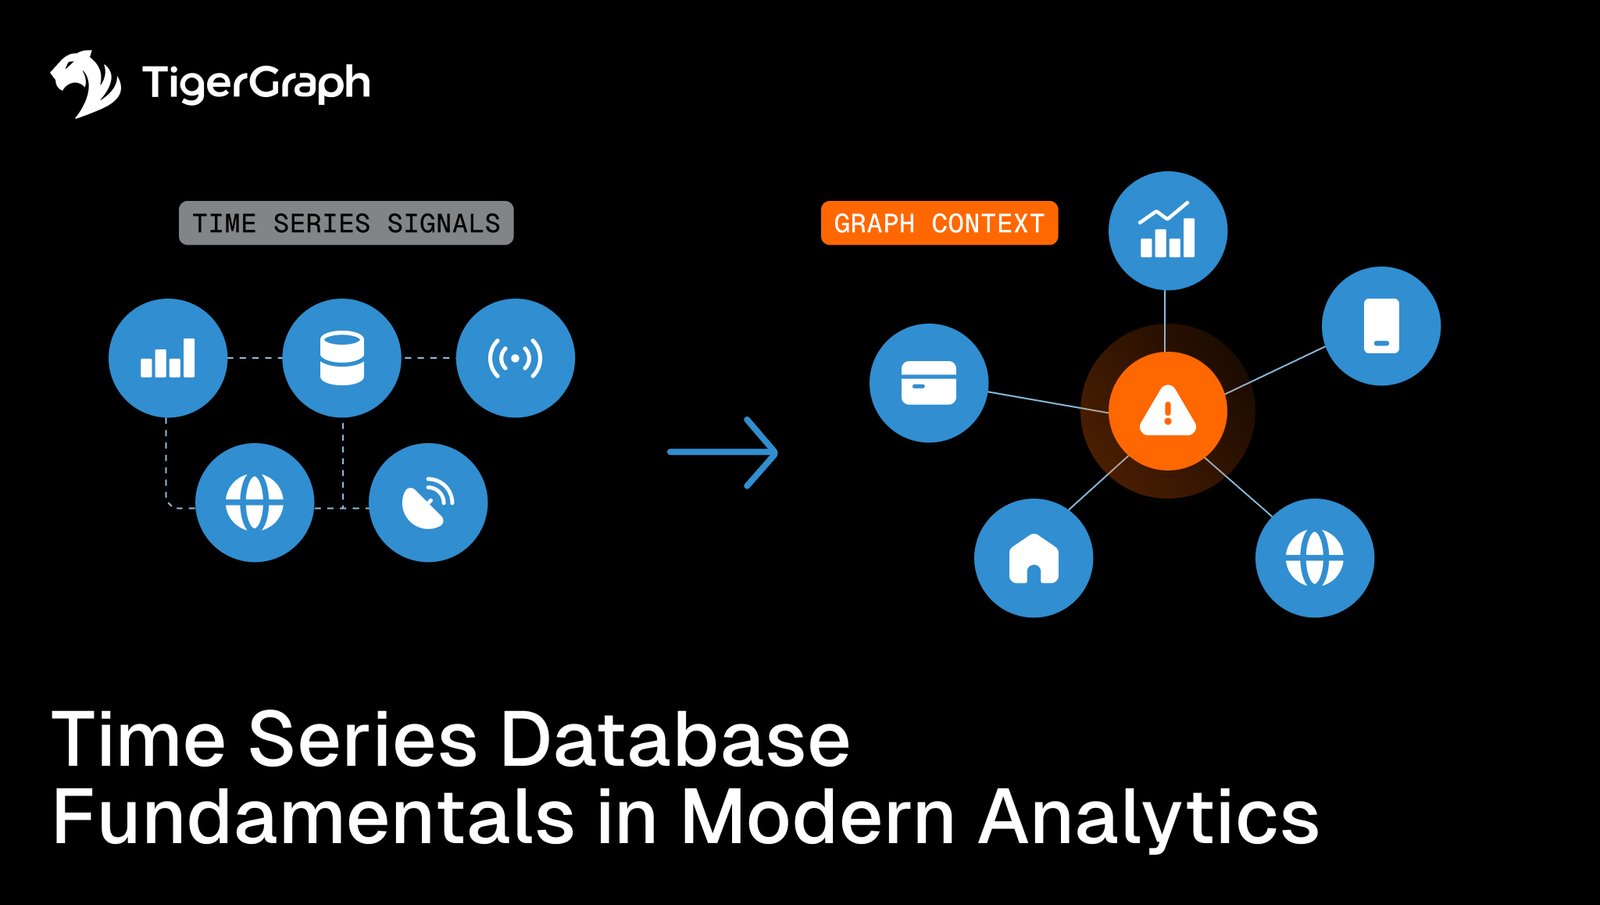
A graphic showing time series signals turning into graph context, with icons for data, sensors, and networks, alongside the text Time Series Database Fundamentals in Modern Analytics. TigerGraph logo is in the top left.
Time Series Database Fundamentals in Modern Analytics
Discover
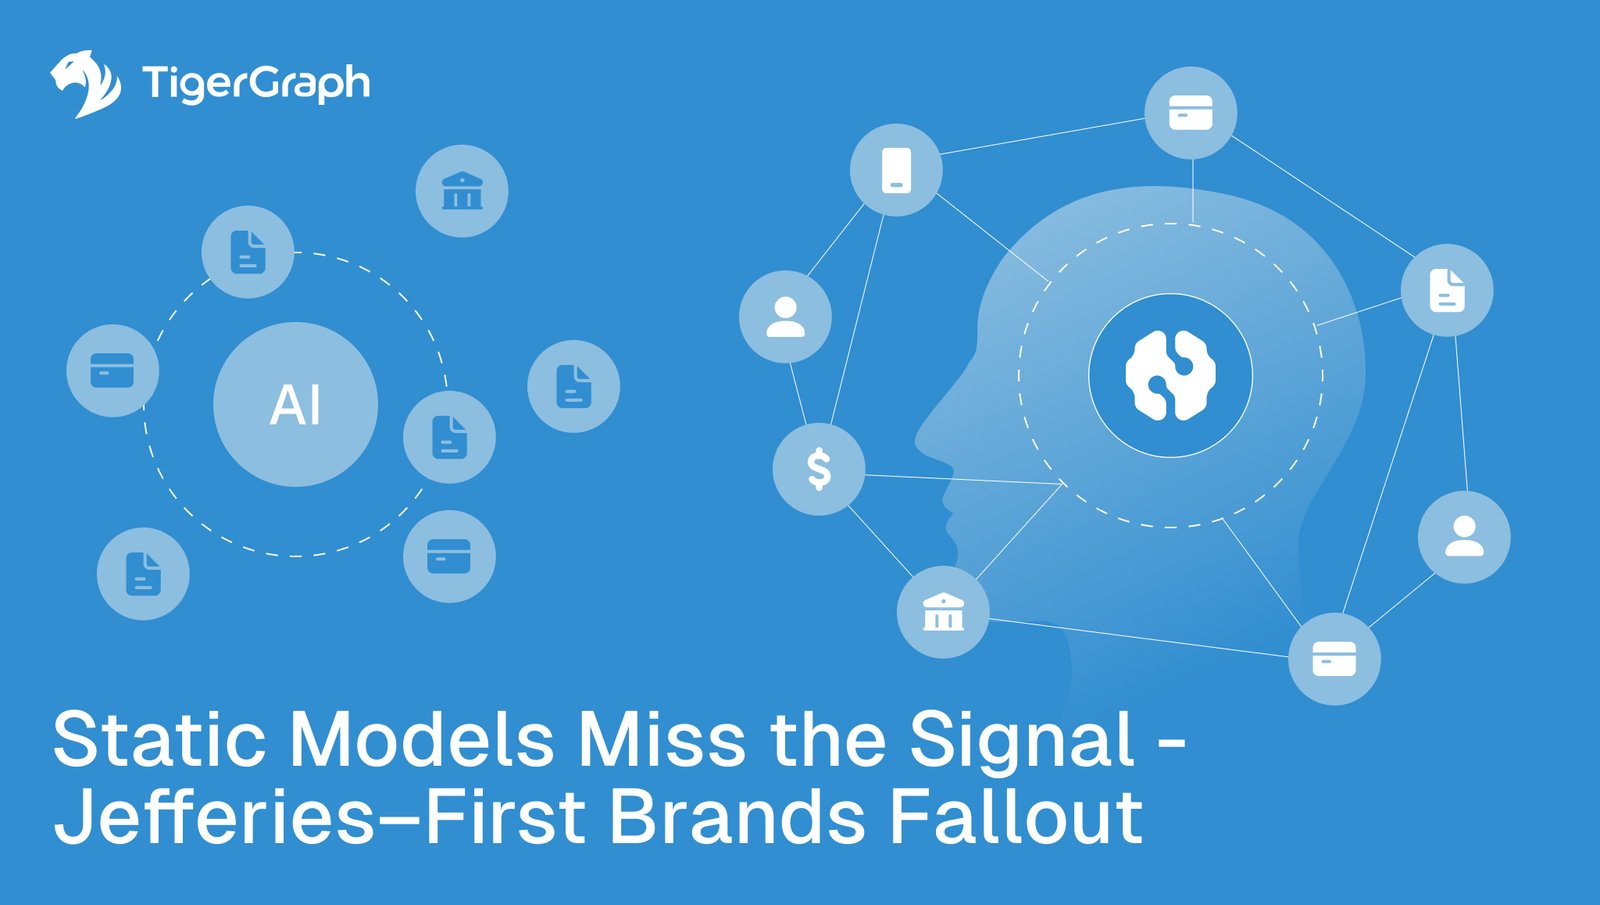
A blue graphic showing AI in a circle, connected documents and banks, and a human head silhouette with financial icons. Text reads: Static Models Miss the Signal – Jefferies First Brands fraud graph intelligence. TigerGraph logo in the corner.
How Jefferies’ First Brands Scandal Exposed the Limits of Static AI and Why Graph Intelligence Is the Future of Financial Risk Detection
Discover
A person in a hoodie with headphones works on a laptop in a dimly lit room; overlay text reads TigerGraph Cybersecurity Use Cases with a shield icon in an orange circle in the center.
Smarter Threat Detection Starts with Connected Security Analytics
Discover
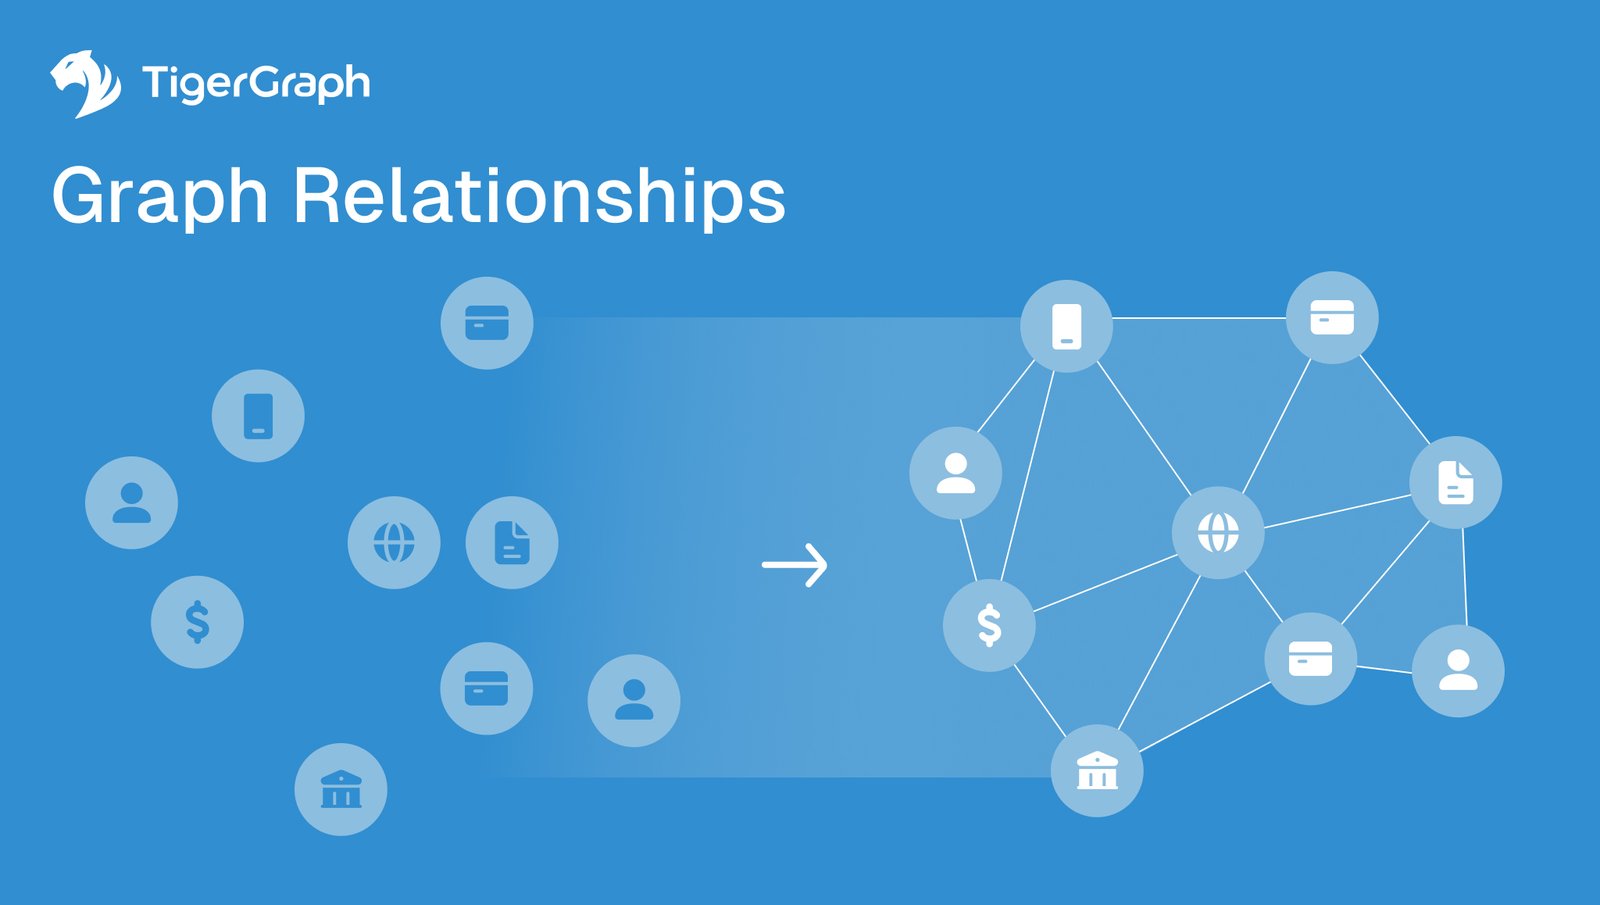
A blue graphic shows isolated icons (users, money, banks) on the left transforming into a connected network of the same icons on the right, illustrating graph relationships. TigerGraph logo appears in the top left corner.
The Power of Graph Relationships: Turning Isolated Data into Connected Insights
Discover
Black background with white and orange dots connected by lines, resembling a network. The TigerGraph logo is in the top left. Center text reads: Knowledge Graph LLM with Knowledge in orange and the rest in white.
Reducing AI Hallucinations: Why LLMs Need Knowledge Graphs for Accuracy
Discover
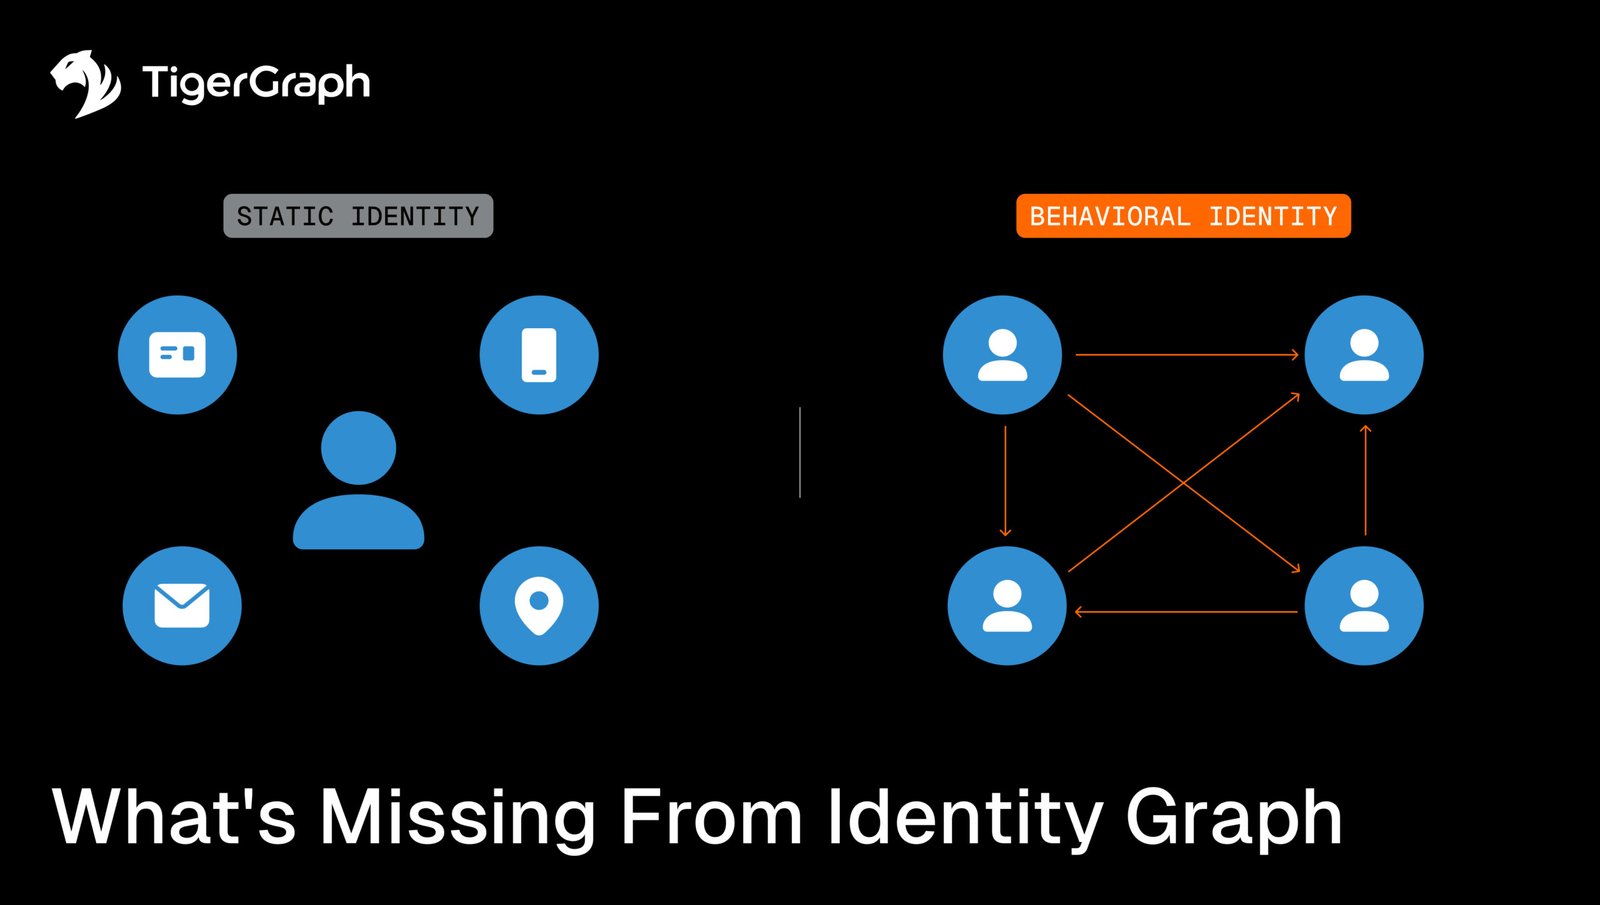
A graphic comparing static identity icons (user, phone, email, location) on the left with interconnected user icons representing behavioral identity on the right. Text: Whats Missing From Identity Graph. TigerGraph logo is at the top left.
What’s Missing from Your Identity Graph? Behavior.
Discover
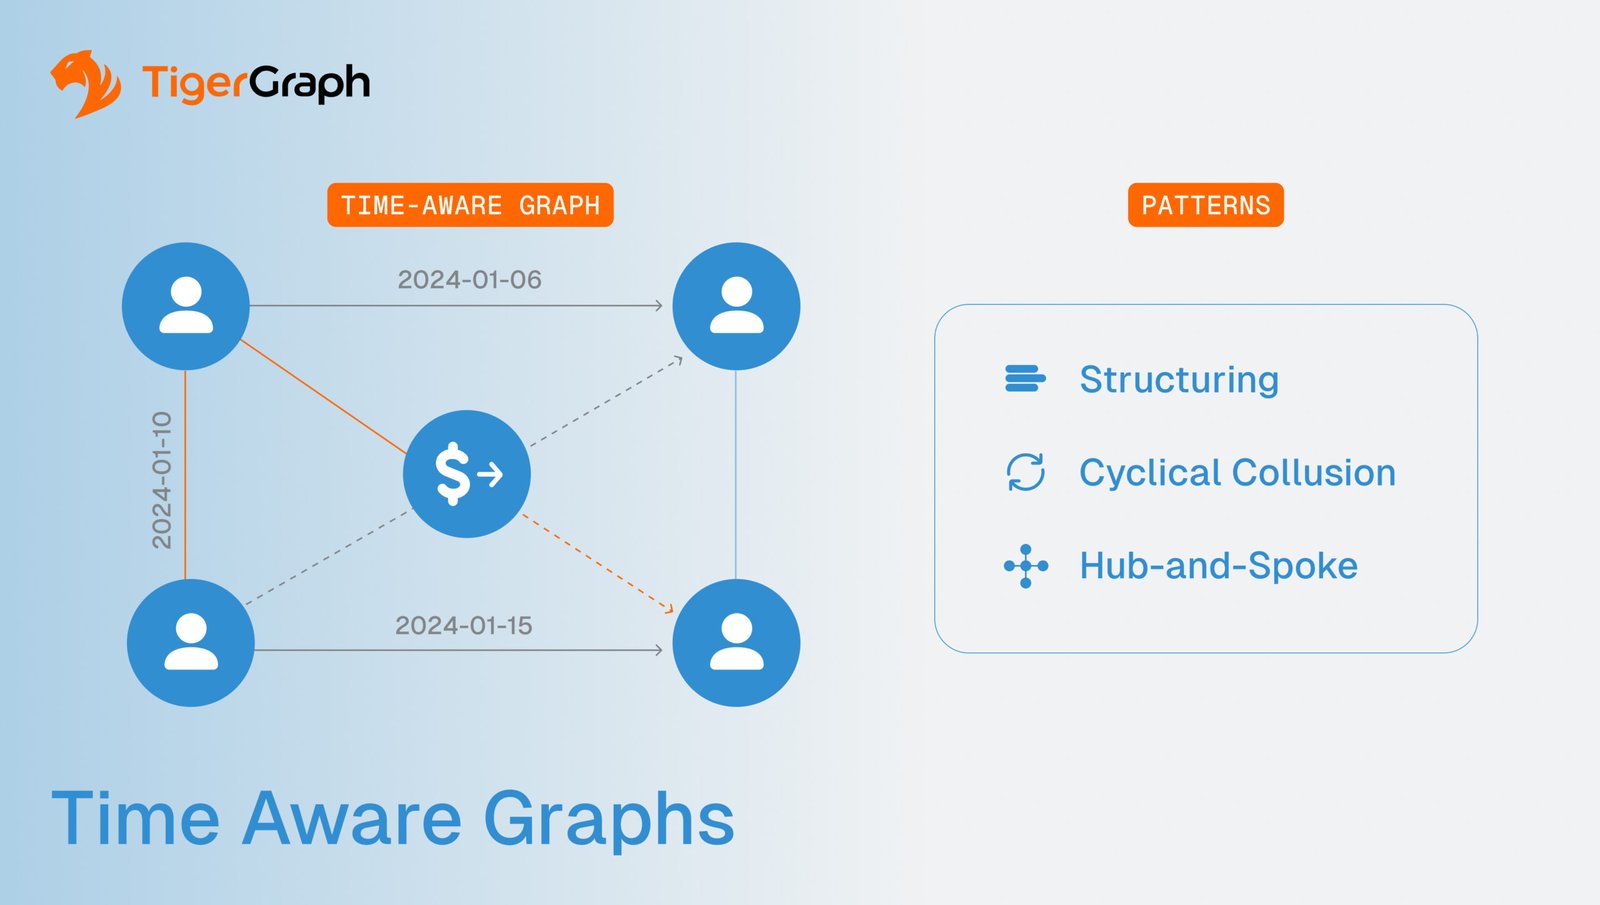
A diagram titled Time Aware Graphs shows four user icons connected by lines with dates and a dollar symbol in the center. On the right, a box lists patterns: Structuring, Cyclical Collusion, and Hub-and-Spoke. TigerGraph logo is at the top left.
Time-Aware Graphs: Solving Temporal Risk in AML
Discover
A dark-themed graphic with the TigerGraph logo in the top left and the text Future-proof KYC against regulatory change in white and orange over a digital world map background.
How to Future-Proof KYC Against Regulatory Change
Discover
Show More