How Graph Could Have Exposed Suspicious Loans for Zions and Western Alliance Banks
When two U.S. regional banks, Zions Bancorp and Western Alliance, reported massive loan losses tied to the same guarantors and investment groups, markets reacted with alarm. The lawsuits allege shared borrowers, misrepresented collateral, and overlapping assets worth hundreds of millions of dollars. What happened?
The data existed. What was missing was connection.
Traditional systems tracked loans, guarantors, and collateral independently. Each bank saw its own records, but none could visualize the larger borrower network forming across institutions. A graph-based approach would have made those links visible long before defaults turned into litigation.
Let’s break down how that looks.
Fragmented Risk and the Blind Spots of Traditional Systems
Every financial institution monitors loan performance, but those records often live in separate silos—lending, property, legal, and risk. Each system captures transactions in isolation, without modeling the relationships between entities across different contexts.
In the Zions and Western Alliance cases, the same borrowers appeared as partners, guarantors, and investors in multiple datasets, yet no alerts fired.
Tabular databases record values, not relationships. They can show exposure within one dataset but cannot connect patterns spanning different banks or loan portfolios.
Fraud thrives in those gaps.
Shared guarantors, co-owned shell entities, and recycled collateral remain hidden until they collapse into losses.
Fraudsters exploit this fragmentation. They distribute their activities across institutions, jurisdictions, and asset classes, knowing that each system only sees a fragment of the pattern.
Common blind spots include:
- Borrowers using multiple corporate entities across banks.
- Duplicate collateral pledged in different loan portfolios.
- Overlapping guarantors who appear legitimate individually but are suspicious as a network.
- Regulatory filings that mention shared assets but sit in separate repositories.
The result is that multiple banks finance the same at-risk borrowers without realizing they are funding a connected scheme.
A Graph Model Reveals What Spreadsheets Miss
Graph technology replaces linear inspection with connected reasoning.
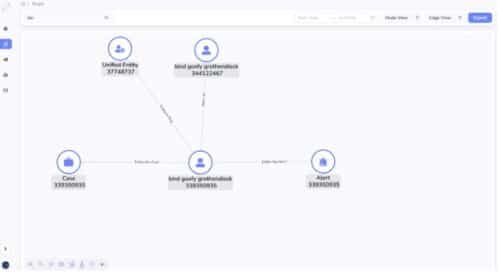
Each borrower, guarantor, property, and fund becomes a node. Each link, shared ownership, co-signing, and litigation becomes an edge. This structure lets investigators and analysts trace multi-hop relationships that traditional databases flatten or overlook.
If Zions and Western Alliance had modeled their portfolios as graphs, a few queries could have exposed:
- Reused property collateral across institutions.
- Guarantors appearing in unrelated loans.
- Funds or LLCs acting as intermediaries between borrowers.
- Shared assets appearing in separate loan pools.
What spreadsheets treat as isolated rows, a graph shows as an interconnected cluster. Patterns that took months of forensic review would have appeared instantly through community detection or entity resolution algorithms.
Here’s how that looks:
From Detection to Reasoning
Fraud analytics built on isolated data can only detect anomalies after the fact. It tells you that something went wrong, but not why or how it spread. Graph analytics changes that by combining structural relationships with behavioral context, turning detection into reasoning.
- Entity resolution links records that appear under different names or ownership structures, matching addresses, phone numbers, or legal filings to the same real-world individuals or entities. A borrower might surface under multiple LLCs across different institutions, but graph connections expose that single identity.
- Community detection identifies clusters of entities that are connected in many ways, such as guarantors appearing across multiple banks or merchants sharing the same payment gateways. These hidden communities often form the backbone of organized fraud networks.
- Path analysis maps how one default or fraudulent action could cascade through shared assets, intermediaries, or guarantors. It identifies a failure but also shows the chain reaction that precedes it.
Together, these techniques create reasoning in motion. It’s a system that doesn’t just see transactions but understands their relationships. The result is actionable foresight. Insights are delivered in real-time, helping institutions respond before losses escalate.
Combining Graph and AI for Real-Time Insight
Traditional AI models can flag anomalies statistically, but they rarely understand why they occur. Pairing AI with graph reasoning bridges that gap. A hybrid graph + vector database allows AI to evaluate both similarity and connection at once:
- Graph traversal exposes how entities are actually related.
- Vector similarity finds semantically related information in documents, filings, or communications.
- Hybrid queries combine both, enabling cross-domain reasoning across structured and unstructured data.
This architecture supports real-time, explainable detection, letting investigators trace every flagged event back through the relationships that caused it. That transparency builds regulatory confidence and accelerates trust in AI-driven investigations.
From Reaction to Prevention
The Zions and Western Alliance disclosures showed how quickly uncertainty spreads once hidden exposure becomes visible. The larger takeaway, though, is about the urgency of connected risk intelligence.
With real-time graph analytics, financial institutions can:
- Detect shared borrowers or guarantors across loan portfolios.
- Model how a single failure could cascade through other lenders.
- Identify overlapping collateral and shell entities.
- Trigger early warnings as new entities connect to known risk clusters.
Graph reasoning can’t rewrite history, but it helps prevent repetition by making every transaction part of a connected, explainable network.
Why TigerGraph Powers Connected Fraud Detection
TigerGraph provides the graph database infrastructure that enables this level of insight. Its parallel computation engine analyzes billions of relationships per hour, correlating structured and unstructured data from multiple systems in real time.
With pre-built solution kits for fraud detection, AML, and customer intelligence, TigerGraph helps banks deploy connected-data analytics in days rather than months. Its hybrid graph + vector architecture brings relational reasoning and semantic search together, delivering faster insight, traceable results, and scalability across high-volume environments.
By uniting graph structure with AI reasoning, TigerGraph transforms risk management from reactive reporting to proactive intelligence, helping institutions uncover exposure before it becomes loss.
Summary
The Zions and Western Alliance lawsuits exposed the vulnerability of traditional systems to fragmented data. Fraud doesn’t hide in numbers; it hides in relationships.
Graph-based reasoning makes those connections visible in time to act. With TigerGraph’s hybrid graph + vector architecture, financial institutions gain a unified, explainable view of exposure. This reduces systemic risk and ensures that what once seemed invisible becomes immediately clear.
Ready to Unlock Your Data’s Hidden Value? Reach out today to join thousands of developers and data scientists using TigerGraph’s leading graph analytics platform to solve complex problems with connected data. And start experimenting and prototyping at no cost, with a free TigerGraph Savanna.
Frequently Asked Questions
How could banks have spotted overlapping borrowers or collateral earlier?
Traditional databases track each loan separately, so overlapping guarantors, shared properties, or recycled LLCs remain invisible.
A graph database connects every borrower, guarantor, and asset as part of a single network. By querying relationships instead of rows, analysts can instantly surface clusters of entities that appear across institutions—revealing shared exposure before defaults occur.
Why do traditional loan systems fail to catch coordinated fraud?
Conventional systems monitor transactions, not relationships. Each application, loan, or filing sits in its own silo, so suspicious links—like co-owned shell companies or duplicate collateral—go unnoticed. Graph analytics bridges these silos by showing how entities interact, exposing fraud rings that thrive precisely because legacy tools can’t “see sideways.”
What makes graph reasoning more powerful than anomaly detection alone?
Anomaly detection flags that something looks wrong. Graph reasoning explains why. By mapping how entities connect, a graph model shows the causal path between a suspicious borrower, guarantor, or fund. This transforms detection into explainable reasoning, helping investigators and regulators trace exactly how risk propagated through the network.
How does combining graph and AI improve financial investigations?
AI models excel at spotting statistical outliers; graphs reveal real-world relationships. When paired, graph + vector AI can uncover both semantic and structural similarities—linking documents, filings, and transactions that reference the same people or entities. The result is faster, more accurate insights with full transparency into every decision.
What advantages does TigerGraph bring to connected risk intelligence?
TigerGraph’s parallel MPP architecture and hybrid graph + vector database analyze billions of relationships in real time. Banks can run complex multi-hop queries across portfolios to detect hidden exposure, overlapping assets, and related guarantors—transforming fragmented risk data into proactive, explainable intelligence that prevents losses before they start.
Fraud comes in all shapes and forms across many industries; from account takeovers, to transaction fraud, the financial services industry to healthcare, fraud is both prevalent and costly for many companies. As the world becomes further interconnected and increasingly digital, businesses must adapt to better fight fraudulent activities. In this blog, we will apply graph machine learning techniques to improve fraud detection by up to 20% in the Ethereum blockchain. Follow along with this Jupyter notebook.
Structure of Fraud
Fraudulent activities come in many forms, but a core idea behind fraud detection is to find individuals who behave similar to suspected fraudsters. This might mean using the same address or device id or conducting a similar series of transactions. Given these similarities, and known fraudulent behavior, one can find many fraudsters based on the knowledge of how one operated. The same logic applies to using machine learning for fraud detection. Data scientists need to extract features to feed to their ML pipelines that capture the similarity of various entities that they are trying to classify. In the case of this blog, we are going to be utilizing the structure of Ethereum blockchain transactions to detect account takeover fraud.
Why Graph Machine Learning?
As data scientists try to generate richer features that capture the similarity between different entities, they often look towards graph data structures. Graphs provide a very natural way to represent relationships between entities, such as “Person 1 used Device 36” or “Person 2 transacted with Person 723.” Making a profile of relationships and comparing profiles is the basis for many similarity determinations. If two persons use the same IP address, they will be connected in the graph: Person 1 → IP333 ← Person 2. Additionally, two accounts that transacted with one another would be connected as well. By analyzing these connections and relationships, data scientists can use graph algorithms to extract new features that they wouldn’t have been able to in a traditional tabular setting due to the compute cost of implementing the algorithms through complex JOIN operations. As TigerGraph is a very scalable and performant graph database, leading financial institutions use TigerGraph to compute these novel graph features.
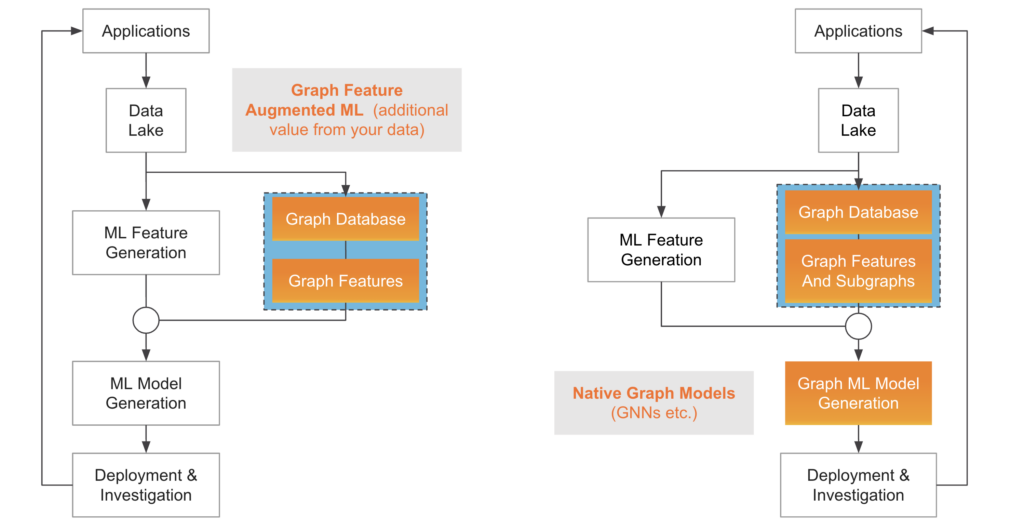
Two methods of Graph Machine Learning. Pictured on the left is incorporating graph features with traditional ML models, while the right represents utilizing native graph ML models such as GNNs.
Graph Machine Learning Applied to Ethereum Fraud Detection
While graph features are a good starting point to detecting more fraud, “native” graph models, such as Graph Neural Networks, incorporate the relationship between data points in a more direct and holistic manner, thereby reducing the need for complex feature engineering pipelines. This gives rise to two different approaches to take when incorporating graph machine learning techniques into data pipelines: one in which graph features are extracted and then passed to traditional, tabular ML models such as XGBoost, or one that uses graph neural networks to make their predictions.
Ethereum Transaction Dataset
The dataset used in the demo comprises transactions on the Ethereum platform, forming a transaction graph for Ether, the second-largest cryptocurrency. Wallets (i.e., accounts) on the platform serve as vertices in the graph, while edges represent transactions between these accounts. With 32,168 vertices and 84,088 edges, the dataset is derived from the publicly available Ethereum dataset from XBlock. We will be predicting if an account is fraudulent or benign.
TigerGraph Schema for the Ethereum Dataset
As a baseline test, the notebook trains a model using features that a data scientist might normally calculate in a traditional tabular manner. This includes the amount an account has received, the amount that it has sent, the number of transactions that it has received and sent, and the minimum of the transactions that have been sent and received. Using these features, an XGBoost model achieves a 77% accuracy on the fraud detection task. We will now add more graph-derived features to the model to see how incorporating information from the graph structure of the dataset will improve the accuracy of the fraud detection.

Graph Features And Traditional Machine Learning
The next model in the notebook trains an XGBoost model that incorporates three different graph features: PageRank, Betweenness Centrality, and Weakly Connected Component size. These features are some of the more common algorithms to execute in fraud detection use cases. TigerGraph offers a library of over 50 built-in graph algorithms, organized into seven categories. The notebook’s three features fall into two of those categories described below.
- Centrality: Centrality algorithms, such as PageRank and Betweenness, can measure the influence or closeness of a vertex to others within the graph. Many fraud patterns exhibit higher than average centralities, so these can be useful features for training an ML model.
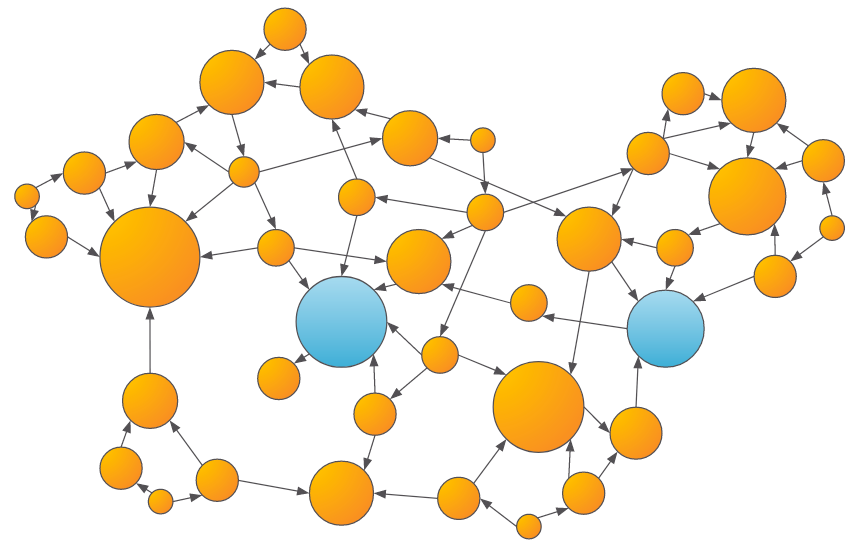
An example of the output of a centrality algorithm, where larger scores are denoted by larger vertices. Entities that are more central have more transaction inflow and outflow, which may be fraudulent behavior.
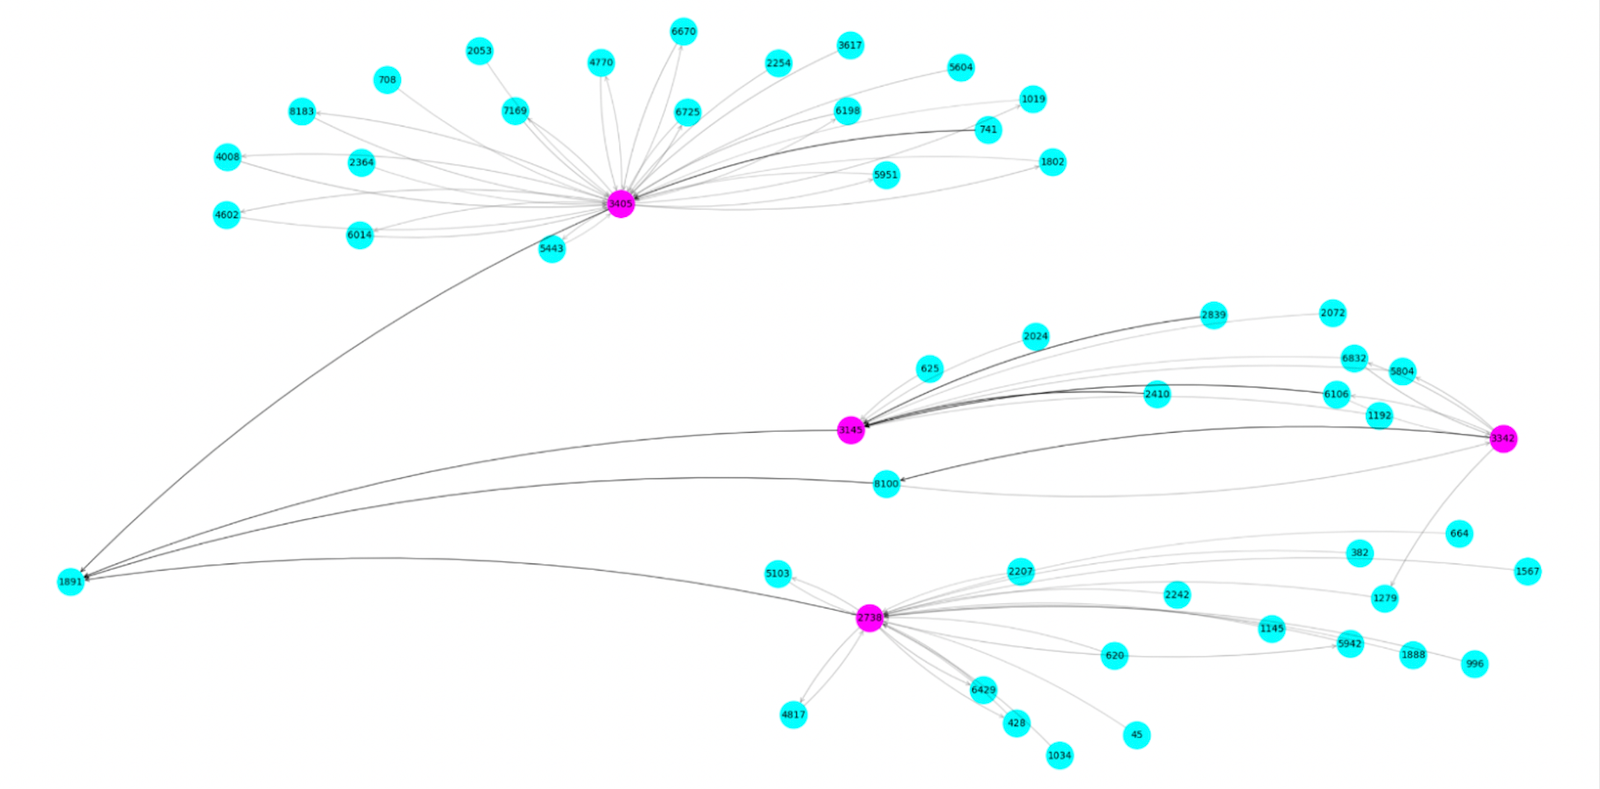
- Community Detection: Community algorithms, such as Weakly Connected Components (WCC) or Louvain, can be used to determine groups of vertices that share common characteristics or heavily interact with each other. Once the communities are determined, features such as the community size, the number/amount of transactions within the community, and more can be calculated and passed to the ML model.
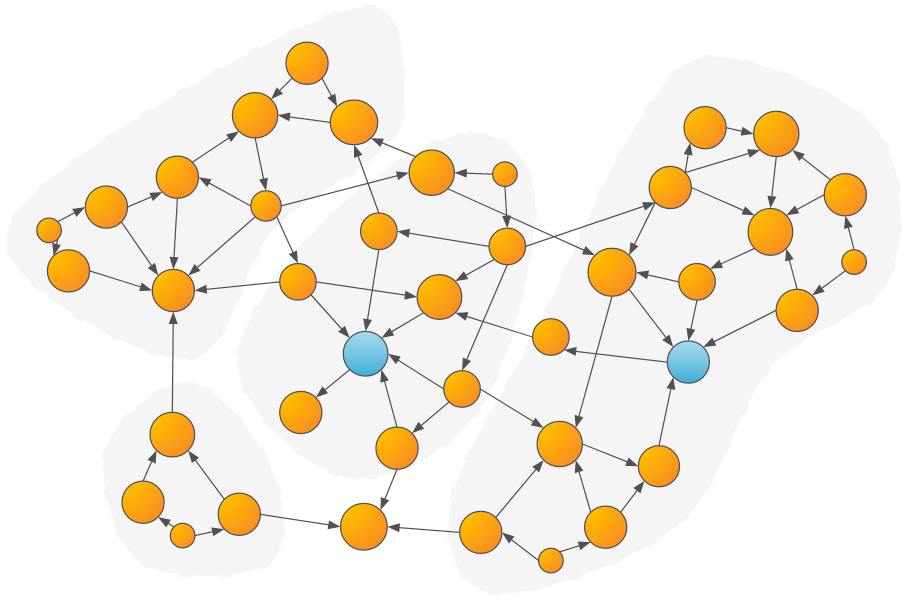
Example of communities detected within a graph. Parties that are within the same community as a suspicious party might be more likely to be suspicious as well.
Another important graph algorithm category is Shortest Path. While not used in this demo, shortest path algorithms can answer questions like “how close is the entity in interest to a known fraudulent entity?”, which may provide a useful signal to the downstream machine learning model.
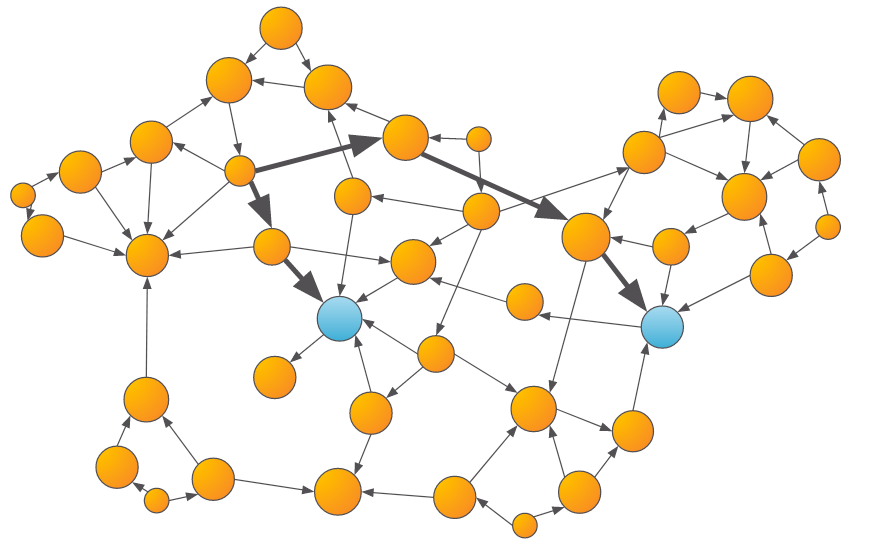
An example of shortest path algorithms determining how close an entity is to a known fraudulent entity.
The different features calculated in the Ethereum dataset resulted in an increase of the XGBoost model accuracy. When used with the traditional features we calculated beforehand, the model achieved a 91% accuracy, a 14% accuracy improvement! In addition, we can view the importance of the features in the model’s decision, and see that PageRank and the size of the Weakly Connected Component are quite important in the model’s classification.
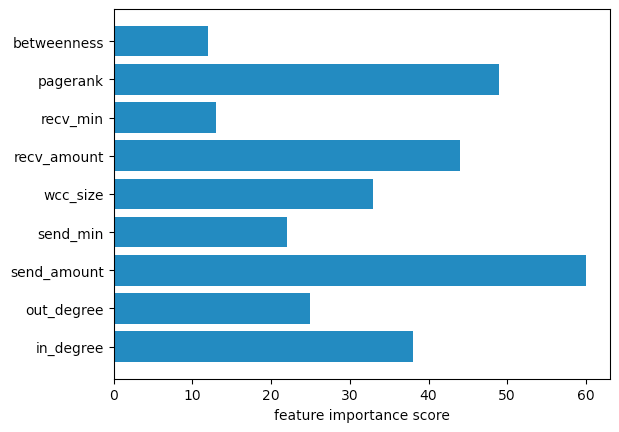
Global feature importance scores from the XGBoost Model trained on graph-derived features.
Graph Embeddings
Graph embeddings are a way to capture a lot of information about the graph in an unsupervised manner, without the need for time-consuming feature engineering that some of the other approaches require. TigerGraph offers graph embedding algorithms in its graph data science library and in its pyTigerGraph Python library. The specific approach that we use here is called FastRP, or Fast Random Projection. The idea behind this algorithm is to perform operations on the graph’s adjacency matrix such that vertices that are highly connected in the graph are close to each other in the embedding space produced.
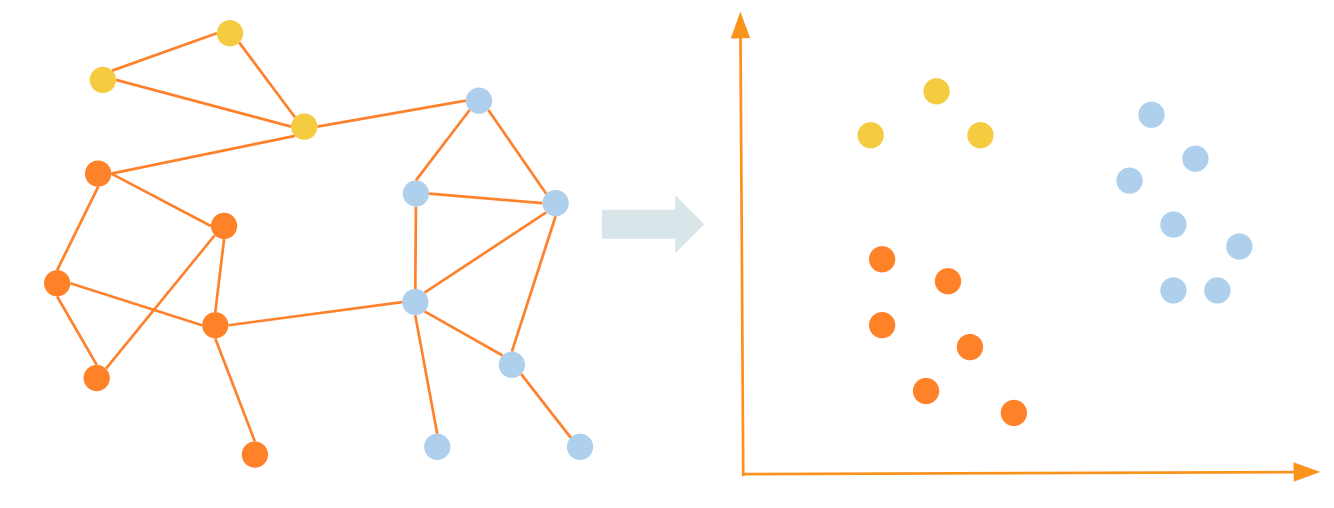
Graph embeddings map vertices that are close together (well connected) in the graph to areas within the embedding space such that they remain close to each other.
Graph embeddings are the best way to incorporate the most amount of graph information into traditional ML algorithms such as XGBoost. However, they do come at a considerable memory and computational cost, so they are not always used. In the Ethereum notebook, we saw they contributed an additional 3% accuracy increase over the model incorporating graph features, for a 17% increase in accuracy over the baseline model. Additionally, as the figure below shows, the holistic nature of an embedding means that it contributes far more to the model than any other single feature.
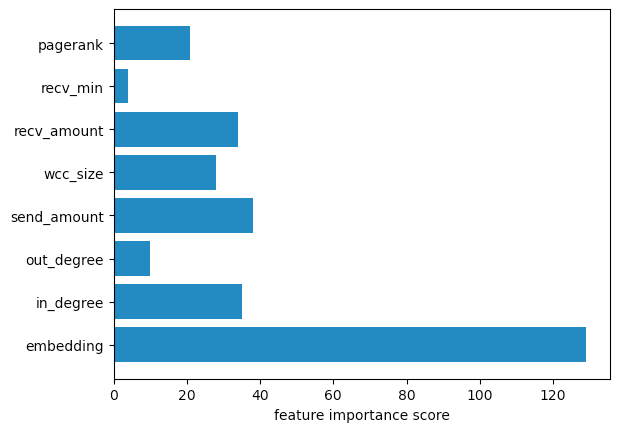
Global feature importance scores from the XGBoost Model trained on graph-derived features and FastRP embedding.
Graph Neural Networks
Graph Neural Networks (GNNs) are a flavor of neural network architecture that operates on graph data structures. These algorithms take into account both the numerical attributes of vertices in the graph, but also the edges between the vertices explicitly. This method can result in an additional accuracy lift over just incorporating graph features into traditional machine learning models. Additionally, they can provide an extra layer of explainability to investigators, as the model not only provides feature importance, but also the importance of the edges between different vertices in the graph.
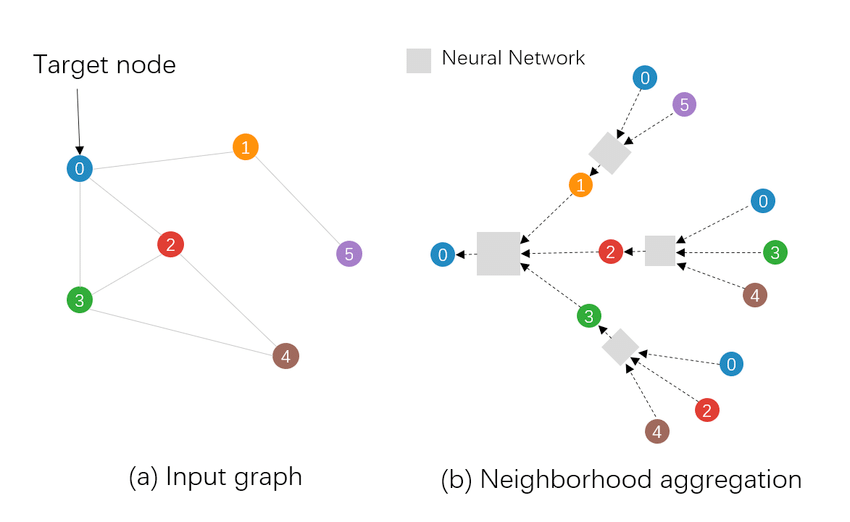
Example of how a Graph Neural Network makes its predictions.
By using the built-in GraphSAGE model in pyTigerGraph, we trained a GNN on the Ethereum dataset. This resulted in an accuracy of 97%, a 20% improvement in accuracy over the baseline model! Additionally, we can view the local feature importance and the subgraph used to analyze why the model made the prediction it did for the exact account we are interested in.
Conclusion
While the example of the Ethereum dataset used throughout the blog focused on one type of fraud and a relatively simple dataset, the ideas presented carry throughout various different industries and types of fraud. By incorporating information about the structure and relationships between data points, graph machine learning techniques provide a substantial accuracy improvement over traditional machine learning techniques. TigerGraph can compute graph-derived features scalably and performantly, leading to more actionable insights and improved outcomes for businesses.
Compilation of results from the Ethereum demo. As more graph structure is incorporated into the ML model, accuracy improves.
A note on TigerGraph
TigerGraph is the leading platform for analytics and machine learning on connected data.
TigerGraph Inc. was established in 2012 and is based in Redwood City, California. TigerGraph is successfully deployed and is adding value to Forbes 2000 customers all over the world. TigerGraph was included in the Gartner Magic Quadrant in 2022, and inducted into the JP Morgan Chase Hall of Innovation in 2021. Forrester Research calculated the average ROI from TigerGraph at over 600% with a payback of less than 6 months.
TigerGraph is the only graph database powerful enough to run graph algorithms at the scale and accuracy required for fraud detection in large enterprises like financial institutions. TigerGraph runs most graph algorithms 10x to 1000x times faster than its nearest competitors, providing more answers, more efficiency, and more time to converge to correct answers. When it comes to scale, there’s no competition. TigerGraph is the only answer for multi-terabyte graphs in a single, non-sharded database.
There are many ways to use TigerGraph – on cloud or on premises. You can sign up for a free instance of TigerGraph Cloud at tgcloud.io or contact us at info@tigergraph.abstage.xyz to find out more.
Bank fraud is a serious concern that affects financial institutions and their customers worldwide. Large organized criminal groups are often the primary perpetrators of fraud, and understanding their tactics is crucial for effective detection and prevention. In this blog post, we will provide a clear and concise overview of bank fraud, its distinctiveness from anti-money laundering (AML), the two main types of fraud (loan and credit card fraud), and how TigerGraph’s detection methods contribute to combating fraud.
Fraud vs. AML: Fraud and AML may appear similar from a data and analytics perspective, but they have distinct commercial implications and are dealt with separately within banks. Fraud involves criminals misrepresenting their identity to steal money from the bank or its customers, primarily resulting in financial losses. AML, on the other hand, focuses on monitoring and reporting money movement to prevent criminals from hiding illicit funds, with non-compliance potentially leading to fines for banks.
Two Types of Fraud: Loans and Credit Cards: Fraud within the banking sector can be broadly categorized into two main types: loan fraud and credit card fraud. Loan fraud typically involves criminals setting up accounts, engaging in legitimate transactions until their credit rating allows them to borrow money, and subsequently absconding with the borrowed funds. Credit card fraud, on the other hand, encompasses criminals either applying for or taking over someone else’s card to withdraw cash or make purchases that can be resold for cash. In both cases, the intention not to repay the borrowed funds or settle the card charges constitutes the fraudulent act.
Detecting Fraud: There are two critical points at which fraud detection becomes crucial: during the application process and at the time of the fraud itself. Detecting suspicious accounts during the application stage involves assessing whether the provided information aligns with known patterns and connections to other suspicious accounts. Detection at the time of the fraud relies on identifying abnormal transaction patterns within the account, often in conjunction with changes in behavior observed in connected accounts.
Detection and Investigation: Fraud detection teams primarily focus on two activities: detection and investigation. Detection aims to identify suspicious accounts and activity through automated means, often utilizing machine learning algorithms. The challenge lies in striking a balance between detecting as much fraud as possible while minimizing false positives and not mistakenly flagging genuine customers as fraudsters. Investigation, on the other hand, involves confirming whether a suspicious account is indeed involved in fraudulent activities. This step typically requires human intervention by trained fraud investigators and can be resource-intensive due to the complexity and volume of transactions associated with fraudulent accounts.
TigerGraph’s Contribution to Fraud Detection: TigerGraph, a leading provider of fraud detection solutions, employs various methods to detect and combat bank fraud effectively. One crucial step is consolidating information to establish connections between accounts and transactions, enabling the identification of suspicious individuals and groups. TigerGraph leverages advanced techniques such as Shortest Path, (Personalized) Page Rank, Louvain Community, and Weakly Connected Components to assess the proximity of an account to known suspicious accounts, determine its centrality in a network, and identify connections to suspicious groups.
Additionally, TigerGraph’s behavioral analysis focuses on monitoring changes in account activity in real-time, both for the account in question and its closely connected accounts. By analyzing transactional behavior and detecting significant changes, TigerGraph’s system can flag potentially fraudulent activities promptly.
Conclusion: Understanding bank fraud is crucial for financial institutions to protect themselves and their customers from significant financial losses. Distinguishing fraud from AML, recognizing the two main types of fraud (loan and credit card), and comprehending the crucial points of detection can aid in implementing effective countermeasures. With its advanced detection methods and focus on consolidating information and analyzing behavior, TigerGraph contributes to the fight against bank fraud, offering financial institutions the tools they need to detect and prevent fraudulent activities in a timely and cost-effective manner.
For more questions, and to connect to our team, please contact us at info@tigergraph.abstage.xyz.
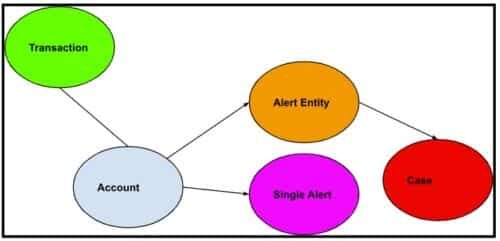
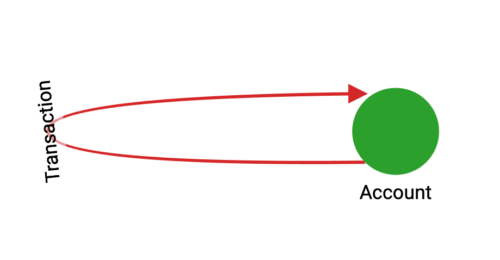
Figure 1: AML generic workflow.
Financial accounts are linked to many transactions. Alert entities are suspicious accounts that are presented to fraud analysts, who can further put alert entities into a case study container.
Introduction
In the world of finance, preventing money laundering is of paramount importance. This blog aims to provide insights into how financial institutions implement Anti-Money Laundering (AML) practices using graph databases. By examining the relationship between commercial accounts, consumer accounts, and their associated financial transactions, we can better understand the steps involved in combating money laundering.
We also observe that although AML software is subject to compliance regulations, its impact on the financial institutions’ overall revenue may not be direct. However, it is worth mentioning that the same techniques and frameworks employed in AML software can be effectively utilized to identify instances of fraud and minimize the number of false positives encountered by fraud analysts. This, in turn, alleviates the workload on analysts and leads to significant operational cost savings for financial institutions.
Accounts and Transactions
Financial institutions serve both commercial and consumer customers, each having their respective accounts (blue node). These accounts are linked to numerous financial transactions (green node), including deposits, withdrawals, money transfers, and more. By analyzing these transactions, institutions can identify suspicious activities indicative of money laundering.
Steps to Combat Money Laundering
1.Run an entity resolution algorithm on all accounts based on common address, common phone, common ssn etc. to detect identical or similar accounts and merge them into one entity.
Note: This step is easy in TigerGraph GSQL, but not easy by relational database or Neo4j Cypher. This is a graph clustering algorithm problem, GSQL’s accumulator makes it easy.
2. After grouping all accounts, the transactions of each account group will be used to generate single alerts (pink node). Each alert means some rules are violated. Common rules are:
- Does the account have a transaction that has been marked as fraudulent?
- Does the account reside in a group whose group size is 100 or above? Looks like a non-human natural setup!
- Does the account have international wire transfer (inbound or outbound) passing a threshold? Red flag!
Note: This is a 1-hop aggregate query, it check each account’s transactions, and insert into the graph a “single alert” node, and connect the newly created node with the account node. GSQL supports insertion of nodes and edges.
3. Based on the generated alerts, risk scores are calculated for each account group. These risk scores provide an overall indication of the associated risk level. If an account group’s risk score exceeds a predefined threshold, an “Alert Entity” node is created. Such entities are subjected to thorough scrutiny by alert analysts. Alert analysts can further create a “case” node to group a set of related alert entities.
Note: This is a 1-hop aggregate query, it check and aggregate each account’s single alerts, and insert into the graph “Alert entity” node, and connect the newly created node with the account node. GSQL supports insertion of node and edges.

4. Case analysts can further examine the case for further fraud study.
Why Graph Database
Entity resolution is easier. Fraudulent users have finite physical resources– IP, device, residential address, SSN etc. By grouping accounts based on those finite resources, we can find suspicious account groups that are artificially manipulated by fraudsters. Graph database can naturally run a weakly connected component algorithm or other unsupervised cluster algorithms to find such account groups, which is hard in relational database.
Avoid ad hoc joins. Graph storage format is just a better way to manage data. Why? Essentially, unlike relational databases which do runtime join to connect table rows at a per query basis, graph database obviate the runtime join for all queries. Instead, graph database materialize all joins at loading time. When you finish the initial data ingestion, or you do incremental data ingestion, each insertion materialize a relationship. At runtime, you just traverse the edge (relationship) for a source to a target, you never need to do a join for two vertices that you know they have a relationship. For example, in step 2 above, if you use a graph database, you just aggregate all transactions following the edges from the transactions to their linked accounts. But in relational databases, you need to join the transaction table with the account table to achieve this. In step 3 and 4 above, when alert entity or case are presented to the fraud analysts, they will double click the alert entity or the case, which brings them to a graph (network) exploration panel, the alert entity’s 1-hop neighborhood will be unfold on the screen (no join for graph database here, but will trigger a runtime join for relational database query engine), and the analysts can continue her ad hoc double click to investigate the traces of the alert entity, 3-hop, 4-hop etc., all have not join cost for graph database, but a join cost for relational database. In other words, graph database storage is just smarter, in that it can avoid repetitive runtime joins by materializing joins as edges. It is just greener for the planet.
Why TigerGraph
Scalability: transactions are large, can be 500G to 10T. TigerGaph has been proven to be capable to handle 100T challenging multi-hop queries.
Performance: MPP architecture can do this AML flow parallelly for all accounts. It’s a data mining problem involves both unsupervised clustering and semi-supervised rule filters. You need to examine each account and its transactions.
Advanced Aggregation support from Query Language: GSQL query language’s accumulator ingredient makes this ad-hoc vertex-centric aggregation easy. I don’t see how other query languages can do this. The closest one may be SQL stored procedure, but it’s not as good as an accumulator since graph query is vertex oriented, we need to leave side-effects (runtime attributes) on vertices for later iteration examination.
Mutability: TigerGraph allows queries to insert nodes and edges. This makes alert and case generation possible.
Contact
If you need to see an AML demo, please contact us here info@tigergraph.abstage.xyz.