Summary
- Conventional supply chain analytics tools forecast risk at individual suppliers, shipments, or SKUs, but struggle to model how that risk spreads across multi-tier dependencies in real time.
- Graph databases model the supply chain as a connected network of entities and relationships, giving predictive models the structural context to trace how disruption cascades before it becomes a missed shipment.
- The gap between seeing a risk signal and understanding its downstream impact is where most supply chain analytics tools break down, and where graph makes the biggest difference.
- Graph is most valuable for multi-tier supplier risk mapping, cascade simulation, relationship-aware demand sensing, and AI-enriched disruption forecasting.
- Graph does not replace existing ERP, planning, or BI tools; it adds the relationship layer those systems need to turn isolated forecasts into network-aware predictions.
Most predictive analytics applied to a supply chain can warn leaders that a disruption is coming. The harder question is what happens next: which suppliers are exposed three tiers upstream, which products and customers are affected downstream, how the disruption will cascade through the network, and which recovery path reduces the most risk. Conventional supply chain analytics platforms often struggle here because they forecast individual records: a supplier, shipment, warehouse, or SKU in relative isolation. Graph databases add the missing relationship layer, modeling the supply chain as a connected network of dependencies and giving predictive models the context to evaluate how risk moves across that network in real time.
You’ll learn:
- Why conventional supply chain analytics hits a ceiling when disruption cascades across multiple tiers
- What graph databases add to supply chain predictive analytics, and how they work
- How graph and AI improve disruption forecasting together
- Where the approach applies across enterprise supply chain operations
Why Conventional Supply Chain Analytics Hits a Ceiling
Most enterprise supply chain analytics tools explain what has already happened. BI dashboards, ERP-embedded analytics, transportation systems, and planning platforms can show where delays occurred, which suppliers underperformed, and where inventory fell short. That visibility matters, but predictive analytics in supply chain now has to answer a harder question: when disruption starts, how will it move through the entire network?
Resilinc reported a 38% year-over-year increase in global supply chain disruptions in 2024, while McKinsey found that 82% of surveyed companies said new tariffs affected their supply chains. Many conventional platforms were not built for that level of volatility. They organize data around individual records: a supplier, shipment, warehouse, SKU, or region. They can forecast risk at one point in the chain, but struggle to model how that risk spreads through suppliers, manufacturers, logistics partners, inventory locations, products, and customers.
Consider a port closure. A tracking system may flag delayed containers. A planning system may identify shipments at risk. But the bigger question is what happens next: which tier-2 or tier-3 suppliers depend on that port, which production lines will be affected in sequence, which customer commitments are exposed in the next 72 hours, and which recovery option balances cost, speed, and compliance. In many organizations, that analysis still happens manually across spreadsheets, emails, and disconnected systems.
This creates three gaps. The first is visibility: suppliers, manufacturers, carriers, and retailers often run on different systems, making end-to-end transparency difficult. The second is adaptability: static planning models struggle when trade conditions and transportation availability change quickly. The third is context: compliance exposure may sit several tiers deep; demand shifts may depend on substitutions or shared components that a per-record forecast cannot see.
Graph databases address these gaps by adding the missing relationship layer that conventional supply chain predictive analytics often lacks. They do not replace existing tools; they give predictions the connected context needed to show what will happen, where it will spread, and how teams can intervene sooner.
What Is Graph-Based Supply Chain Analytics?
Graph-based supply chain analytics models the supply chain as a connected network of entities, including suppliers, manufacturers, warehouses, carriers, products, contracts, and risk signals, and the relationships between them. Unlike tabular systems that forecast risk for individual records, a graph database stores and queries those connections directly, enabling teams to trace how disruption, demand, and risk propagate across multiple tiers in real time.
A graph database represents the supply chain as a network of real entities: suppliers, manufacturers, warehouses, products, carriers, contracts, and risk signals. Each relationship connects two entities and defines how they interact. One supplier provides a component to a manufacturer. One carrier ships to a distribution center. Both entities and their relationships carry properties, such as lead time, capacity, cost, compliance status, or risk score. The database stores this connected model and makes the relationships directly queryable.
This model unlocks four capabilities that flat analytics miss. First, multi-tier dependency mapping: teams can trace a quality issue at a tier-4 supplier across subcomponents, manufacturers, and finished goods without manually assembling data from separate systems. Second, cascade simulation: when a port closes or a supplier fails, teams can model second- and third-order effects on production schedules and delivery promises before they become missed shipments. A graph database runs that cascade analysis across the live network in seconds, querying stored relationships directly rather than reconstructing them from joins. Third, relationship-aware demand sensing: demand for one SKU may affect related products through substitutions, complements, or shared components, and graph makes those links visible to prediction models. Fourth, real-time supplier risk scoring: a supplier with strong direct metrics may still carry hidden exposure through a distressed sub-supplier or constrained route.
Jaguar Land Rover used TigerGraph to reduce supply chain planning time from 3 weeks to 45 minutes.
Graph vs. Conventional Supply Chain Analytics: Key Differences
Graph-based supply chain analytics does not replace existing forecasting, planning, or BI tools. It adds the relationship layer those systems need to understand how risk, demand, and disruption move through the full network.
| Dimension | Conventional supply chain analytics | Graph-based supply chain analytics |
| Data model | Tables, reports, and siloed systems | Connected network of entities and relationships |
| Multi-tier supplier visibility | Often limited to tier 1 | Configurable depth across supplier tiers |
| Disruption cascade modeling | Manual, batch-based, or spreadsheet-driven | Real-time propagation across connected dependencies |
| Demand sensing | Per SKU, region, or channel | Relationship-aware across substitutes, complements, and shared components |
| Supplier risk scoring | Based on individual supplier metrics | Enriched by sub-supplier, route, material, and compliance relationships |
| What-if scenario speed | Export data, run models, re-import results | Simulate scenarios directly across the connected model |
| Best-fit role | Reporting, forecasting, and planning | Relationship intelligence for predictive and operational decisions |
Cascade modeling and supplier risk scoring create the clearest commercial impact. When disruption occurs, graph helps teams see which production schedules, inventory positions, and customer commitments are exposed before the impact becomes visible in downstream systems. For supplier risk, graph adds context that individual scorecards miss: a supplier may look stable on its own but carry hidden exposure through a constrained route or distressed sub-supplier.
How Graph and AI Power Supply Chain Predictive Analytics Together
Graph databases and AI models solve complementary problems in supply chain forecasting. Graph provides structural context: how suppliers, facilities, products, routes, contracts, and risk signals are connected. AI provides pattern recognition: forecasting demand shifts, delay probability, supplier failure risk, and recovery outcomes. Together, they improve predictive analytics in the supply chain by giving models structural features that tabular data alone cannot provide.
Graph-computed features make ML models more predictive. When a supply chain is modeled as a connected network, analysts can derive structural features – dependency concentration, supplier criticality, distance to risk sources, alternative-path availability – that tabular data simply cannot produce. Graph Neural Networks take this further: rather than relying on hand-engineered features, GNNs learn directly from the structure of the supply chain itself, identifying relationship patterns that historically preceded shortages, delays, or supplier instability. And when graph analytics are combined with anomaly detection, supply chain visibility becomes real time: teams can monitor how risk patterns shift across the network and surface emerging disruptions before they appear as missed shipments or stockouts. TigerGraph’s ML tools support this entire graph ML pipeline – graph feature generation, GNN/XGBoost workflows with NVIDIA accelerated model training, and real-time in-database analytics.
Enterprise Use Cases for Graph Supply Chain Analytics
Graph supply chain analytics applies wherever prediction depends on understanding how suppliers, products, facilities, routes, and risks are connected.
Multi-tier supplier risk and resilience planning. Manufacturers with complex global supply chains use graph to map dependencies across multiple supplier tiers in real time. When a geopolitical event, quality issue, or supplier financial stress emerges, the graph surfaces which components, production lines, and customer commitments are exposed, helping teams act before the risk appears as a late shipment or production delay.
Demand sensing and inventory optimization. Retailers and consumer goods companies use graph to model product relationships: substitutions, seasonal co-purchases, promotional bundles, and shared components. When demand changes for one product, graph-enhanced supply chain predictive analytics can update inventory predictions for related products instead of treating every SKU as an isolated forecast, reducing both stockouts and excess inventory.
Tariff and trade disruption modeling. As tariff policies or trade restrictions change, graph models can re-evaluate affected supplier relationships, routes, materials, and landed-cost assumptions across the network. Because the graph stores how every supplier, material, and route is connected, a policy change at the country level can be traced immediately to the specific products, orders, and customer commitments it affects.
Logistics and transportation route optimization. Graph models transportation networks as connected systems of ports, carriers, lanes, warehouses, and fulfillment centers. When a port closure or carrier capacity constraint occurs, teams can identify affected shipments, trace downstream order impact, and surface alternative routes faster than batch-driven planning allows.
Predictive maintenance in manufacturing supply chains. Manufacturers use graph to connect equipment, sensor signals, maintenance history, spare parts, suppliers, and production schedules. When a sensor anomaly signals a possible failure, graph analytics can estimate the supply chain impact of unplanned downtime and trigger proactive parts procurement before the line stops.
Why Effective Predictive Analytics in Supply Chain Requires an Enterprise-Grade Graph Platform
Conventional supply chain analytics can forecast risk at individual suppliers, shipments, and SKUs. But resilience depends on seeing how that risk moves across the network before it becomes a disruption. The organizations seeing the most value from predictive analytics in supply chain are not replacing their ERP or planning systems; they are adding a graph layer that connects those systems’ data into a queryable network, giving existing forecasting models the structural context they have always lacked.
TigerGraph provides the enterprise-grade graph platform built for this workload: real-time, multi-level supply chain analytics supporting disruption prediction, cascade simulation, and AI-enriched forecasting in one connected system.
Ready to see it in action? Request a demo or explore TigerGraph pricing and free trial options.
FAQs
What is predictive analytics in supply chain?
Predictive analytics in supply chain is the use of historical data, statistical models, machine learning, and AI to forecast future supply chain conditions. It helps organizations anticipate demand shifts, supplier failures, shipment delays, and disruption risks so they can act before those issues become operational failures. The harder challenge is modeling how risks propagate across a connected multi-tier network, not just at individual records.
How does a graph database improve supply chain predictive analytics?
A graph database improves supply chain predictive analytics by modeling the supply chain as a connected network of suppliers, facilities, products, routes, and risk signals. This lets prediction models account for how disruption cascades through multi-tier dependencies, which flat analytics tools often miss. TigerGraph enables feature generation across 10 or more levels of supply chain relationships, feeding that structural context into machine learning models to improve disruption prediction accuracy.
What is real-time supply chain visibility?
Real-time supply chain visibility is the ability to monitor the current state of the supply chain and understand how each supplier, shipment, facility, and route connects to the rest of the network. Graph databases are purpose-built for this because they store and query relationships directly, making it possible to detect how risk patterns are changing as those changes happen, not hours or days later.
What are the best supply chain analytics tools for disruption prediction?
The best supply chain analytics tools for disruption prediction support multi-tier dependency modeling, real-time relationship analysis, AI integration, and fast scenario simulation. BI dashboards and ERP analytics are useful for reporting, but they often lack the relationship-aware prediction needed to model disruption cascades accurately. Graph databases fill that gap by adding connected context to existing forecasting and planning systems.
How does AI improve supply chain analytics?
AI improves supply chain analytics by identifying patterns in demand, supplier performance, and disruption signals that are difficult to detect manually. When AI models are trained with graph-derived features, including supplier network position, dependency depth, and risk proximity, they gain structural context that tabular data alone misses. The combination of graph’s relationship intelligence and AI’s pattern recognition is what makes modern disruption prediction actionable at enterprise scale.
In March 2024, the Francis Scott Key Bridge across the entrance to Baltimore Harbor collapsed when a cargo ship lost power and crashed into it. Tragically, six bridge workers lost their lives. The economic cost has been significant as well. Sea traffic in and out of the harbor was halted for a month. Baltimore is the United States’ number one port of entry for passenger vehicles, work trucks, plywood and laminated wood, nickel, zinc, aluminum, and many other finished and intermediate materials.[1]
Thirty thousand vehicles that used to cross the bridge each day now take longer, slower routes. That includes 5,000 trucks carrying $28 billion of goods.[2] Rebuilding the bridge may take four years.
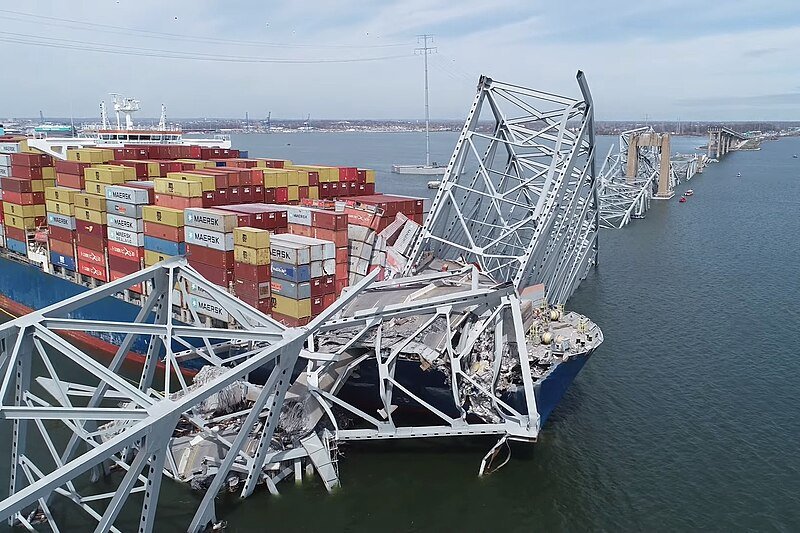
Francis Scott Key Bridge and Cargo Ship Dali, March 2024. Source: ntsb.gov
Was your business impacted by the bridge collapse? How quickly would you know if your supply chain has been disrupted? Many businesses can’t afford to rely on their direct suppliers to make best efforts. These businesses monitor the daily activities of multiple levels of production. In some cases, they acquire at least partial ownership of suppliers, to help to guarantee reliable production.
We can’t predict events like the Baltimore bridge collapse, but businesses can improve their responsiveness and resiliency.
More and more companies are seeing the wisdom of building and maintaining a digital twin of their supply chain – to show them how everything should fit together and to analyze what-if scenarios. From there, businesses can make adjustments to the supply chain to improve performance, lower costs, and increase resiliency.
Graph: The Natural Choice for Supply Chain Modeling
For a supply chain digital twin, a graph database makes a lot of sense. The key entities (components, suppliers, assembly facilities) and their key details (capacity, costs, location, throughput time) can be modeled in almost any database. In a supply chain, however, the connections and dependencies are the whole game, and graphs are designed to treat connections as data.
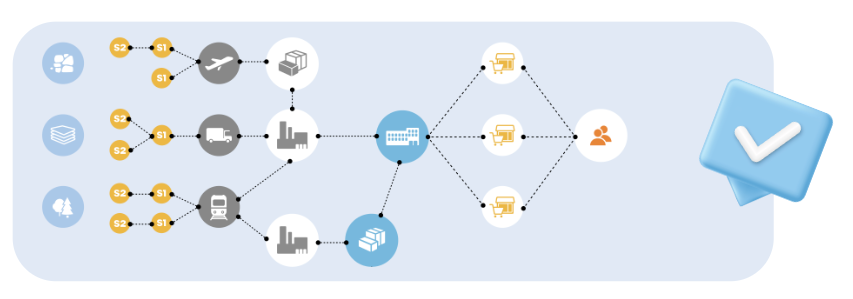
Graphs are a natural model for supply chain modeling.
Traditional data systems have been based on tables of information. A table can answer a simple question like “which suppliers are in Brazil?”, but table-based systems are slow and difficult to use when the task requires tracing several levels of connection to answer more refined questions, such as: what components do the Brazilian suppliers make, which assemblies use those components, which products use those assemblies, who is shipping those products, and who has an important order for those products? For a graph database, on the other hand, tracing downstream from a point is a very simple query, sometimes known as Directed Breadth First Search. If Brazil is modeled as a node, then we could find every affected entity using this GSQL snippet:
Source = {Brazil};
Affected = SELECT t FROM Source:s -(>*)- :t;
Your digital twin can answer questions like:
- • Bill of Materials: List ALL the components needed to produce one unit of a product. Who are all the possible suppliers for each component?
- • Downstream analysis: If plywood arriving in Baltimore is delayed, how will that affect a home builder in Ohio?
- • Upstream (root cause) analysis: a quality control problem has popped for an access panel
An interesting use case is when multiple downstream symptoms occur. We can use the graph-based digital twin to trace upstream for the multiple paths simultaneously, to see where the paths intersect. These intersection points represent possible single causes that resulted in multiple downstream problems, as shown in the following figure:
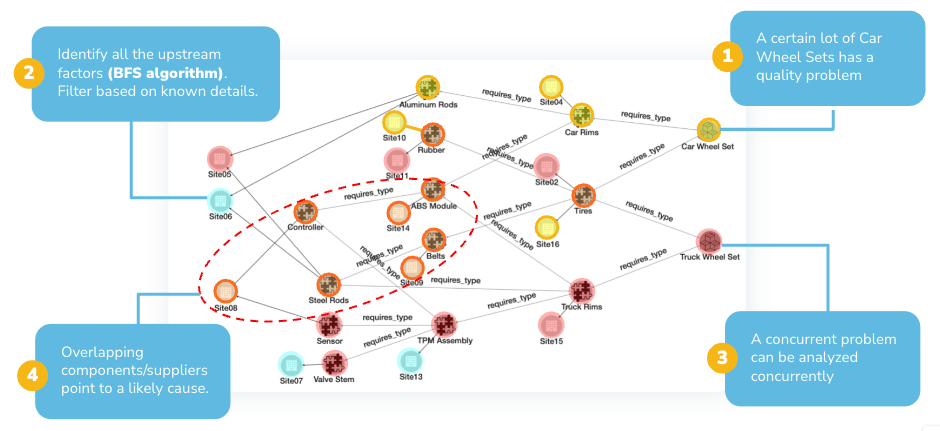
Tracing two quality problems upstream to see if there is a common cause.
The graph-based digital twin gives you the agility to detect problems and respond quickly: trace causes or consequences, uncover alternative paths, and simulate the effect of remediation.
Perform Deeper Analysis
A good digital twin not only understands connections, but it also analyzes them. That is, it can gather data as you traverse the nodes and edges of the graph, perform computations and make assessments in order to calculate scores, find patterns, rank one situation compared to another, and find outliers. Wondering whether using the cheapest supplier for each component actually leads to the cheapest total cost of production? Find the actual cheapest total cost using a weighted shortest path algorithm. Wondering which assembly facility is bringing together the most components for the most different products? The betweenness centrality graph algorithm ranks nodes according to that sense of being “in the middle of things”.
A number of useful analyses can be performed either by generic graph algorithms or predictable analyses used for supply chains, such as “report the bill of materials for product X.” However, every business has unique issues and unique questions. Forward-thinking businesses are looking for platforms that not only handle their needs today, but have the extensibility and flexibility to handle tomorrow’s needs.
Optimize Your Supply Chain for Resiliency
Businesses are seeing that it’s not enough to monitor and react quickly. That’s being reactive. They need to be proactive: anticipate and restructure to reduce the impact of possible disruptions. Businesses need to make their supply chains more resilient, so that they will continue to operate at acceptable levels, despite a range of impacts.
It’s helpful to deconstruct the risk from disruptions into a few components:
- • What is the probability of a disruption?
- • What would be the cost of a disruption?
Estimate Probability of Disruption
Estimating the probability of a disruption can be hard. There are so many factors which are hard to put a number on. It is helpful to break this down into different factors. as weather, government regulations, past performance of the supplier, etc. In some cases, the best you may be able to do is to rank components or suppliers relative to one another. Even without exact numbers, we can logically deduce two axioms:
- 1. Increasing the number of subcomponents required to make a product will increase the likelihood of a disruption.
- 2. Adding alternate suppliers for a component will decrease the likelihood of a disruption.
A digital twin can be programmed to take the estimated probabilities or rankings of base-level factors and then apply the mathematics of probability to compute downstream probabilities. First compute the probability of disruption for the initial stages of production. Then work down level by level until you eventually get to finished goods.
Compute the Cost of a Disruption
If a part is completely unavailable or an essential machine is broken, we trace down the supply chain to see which subsequent operations are halted. Perhaps you have some existing inventory you can use for a while, but at some point, everything downstream will grind to a halt. If the disruption is a price change or a delay, your digital twin can add up those costs too, much the same way that it can compute a bill of materials.
Test and Make Optimizations
Once you’ve scored your supply chain components and suppliers for risk, then it’s time to take action. The analytics will not only point to the most risky aspects, but they will hint at what changed will reduce the risk. Whether the change is to qualify alternate suppliers, to move the location for an operation, or to seek a more modular design with interchangeable parts, the digital twin allows you to simulate the expected result and to monitor actual results.
The Benefits of Graph-Based Digital Twins
Businesses in many different sectors, from automobile manufacturing to personal care products, grocery stores, and biotechnology are exploring and using a graph analytics platform like TigerGraph to model their supply chain or manufacturing processes. The benefits they see include:
- • The ability to model very complex systems in an easy-to-understand and easy -to-update fashion
- • Rapid and flexible reports on upstream and downstream dependencies
- • Analytical tools for optimizing and improving the resiliency of their processes
- • The ability to easily develop new analytics
- At TigerGraph’s recent Graph AI Summit, a workshop focused on a graph-based digital twin solution for supply chains.
TigerGraph will soon be releasing Solution Kits targeting supply chain and other operational network use cases. To learn more, visit tigergraph.com or drop us a line at info@tigergraph.abstage.xyz.