In today’s data-driven world, artificial intelligence (AI) is transforming industries by providing unprecedented capabilities in automation, prediction, and decision-making. However, as we integrate AI systems more deeply into our lives and businesses, the need for explainability, interpretability, and ethical responsibility becomes critical. This blog post explores how leveraging graph technology can enhance these aspects, creating a more reliable and ethical AI landscape.
Unique Partnership and Innovation
At the heart of this transformation is our unique partnership between TigerGraph and EBCONT. TigerGraph, with its best-of-breed graph database technology, excels in discovering deep insights from complex, connected data. TigerGraph’s platform stands out for its ability to handle massive datasets with exceptional speed and scalability, enabling real-time analytics and advanced machine learning applications. TigerGraph’s technology supports intricate data relationships, providing unparalleled performance for sophisticated analytics tasks.
At EBCONT, a global IT solutions provider, we integrate TigerGraph’s cutting-edge technology with our customers’ business vision and leverage modern data management practices. Our innovation team manages end-to-end solution delivery, encompassing a wide range of expertise, including custom business application development, UX/UI design, data integration, and advanced analytics. Together, with TigerGraph’s unparalleled graph technology and our expertise in creating comprehensive solutions, we are positioned to drive transformative changes across industries.
The Revolutionary Impact of Generative AI
Generative AI, particularly through the use of Large Language Models (LLMs), represents a significant leap forward in AI development. These models are capable of generating human-like text, making them valuable for a wide range of applications from chatbots to content creation. LLMs learn from vast amounts of data, allowing them to perform complex language tasks and provide sophisticated responses.
While generative AI offers immense potential, it also brings challenges, with privacy being a paramount concern. Instead of exposing sensitive data to public websites or external sources, companies must ensure their data remains within their own secure environments. When LLMs are trained on public environments, there is a risk that data could be used to inadvertently learn and memorize confidential information, potentially leading to privacy breaches. Ensuring data privacy and compliance with regulations becomes a complex issue, necessitating advanced solutions to safeguard sensitive information.
The Strengths and Limitations of Vector RAG Systems
Retrieval-Augmented Generation (RAG) systems have emerged as a robust and widely embraced solution for tackling the privacy concerns inherent in LLMs. These systems combine the power of LLMs with vector search capabilities, enhancing their ability to retrieve and generate relevant information quickly and securely. RAG systems can transform ingested images, documents, and audio into embeddings, which are then represented with dense vectors. These vectors can be efficiently compared with user queries through similarity measures, ensuring that private data is not directly exposed or memorized by the model. RAG systems excel in indexing and searching large datasets, making them powerful tools for information retrieval.
However, vector-only RAG systems face significant limitations. They often struggle with bias, lack of context understanding, and the potential for inaccuracies in their responses, commonly referred to as “hallucinations”, issues that were already inherent in LLMs. Bias arises because these models can perpetuate the biases present in their training data, leading to skewed outputs that reflect existing patterns rather than objective and deterministic calculations. Furthermore, vector-only RAG systems have difficulty grasping nuanced meanings beyond textual information alone, lacking the deeper contextual understanding required for more complex reasoning.
These challenges stem from the complexities of natural language processing and the limitations of current algorithms, which may not always represent the full context and underlying relationships accurately. While vector-only RAG systems mitigate privacy concerns, we still require advancements in contextual understanding and bias reduction to fully realize the Generative AI potential.
The Unique Strengths of Graph Technology
Graphs offer a compelling solution to the challenges faced by LLM-based and vector-only RAG systems. Unlike traditional data models, graphs excel at representing and consolidating heterogeneous and interconnected knowledge from diverse business domains.
A key strength of graphs is their ability to represent relationships between nodes – documents, concepts, entities – offering a holistic view of interconnected data points. This relationship structure allows for a more comprehensive understanding of the context and dependencies within the data, which is crucial for contextual reasoning and generating deterministic relevant responses.
Furthermore, leveraging graphs can significantly reduce bias, as they incorporate a broader context and a more nuanced understanding of the relationships between data points. This helps in providing more balanced and unbiased outputs compared to traditional vector-only approaches. Additionally, graphs enhance content relevance by ensuring that the information retrieved and used is contextually accurate and pertinent to the query. They also maintain privacy more effectively by structuring data in a way that minimizes the exposure of sensitive information.
By addressing the limitations of vector-only RAG systems, graphs offer a powerful framework for developing more transparent, interpretable, and responsible AI systems, ultimately leading to better decision-making and strategic planning.
A Graph as the Digital Business Intelligence Hub
A Graph serves as a perpetual hub of a business’s expertise digitized, seamlessly integrating domain-human knowledge with enterprise processes data. By representing these two pillars of organizational intelligence in a structured and interconnected manner, graphs become invaluable assets that can be leveraged across various business processes. This comprehensive digital blueprint of an organization allows businesses to:
- Preserve Expertise: Safeguard the specialized knowledge of experts, ensuring that critical information is not lost due to employee turnover or organizational changes.
- Enhance Decision-Making: Provide decision-makers with a holistic view of interconnected data points, enabling more informed and strategic choices.
- Optimize Processes: Streamline and improve business processes by integrating contextual knowledge into everyday operations, from customer service to product development.
- Support Innovation: Foster innovation by making it easier to identify patterns, correlations, and opportunities within the vast amounts of data that businesses generate.
By leveraging Graphs, businesses can ensure that their accumulated expertise and integrated data assets continue to drive value and innovation. This digital transformation not only enhances the efficiency and effectiveness of business operations but also ensures that the organization’s knowledge remains an enduring and dynamic asset.
Solving Real-World Problems with Graphs
Graphs are already making a tangible impact across various industries. By leveraging the unique strengths of graphs, organizations can address specific challenges with precision and reliability. Here are some key verticals where this technology is transforming operations:
Deepening Personalization
For customer-centric businesses, graphs enhance personalization and customer engagement by providing deeper insights into customer behavior and preferences. Applications in this vertical include:
- Product and Service Recommendations: Analyzing purchase patterns and user behavior to deliver highly personalized product and service recommendations, improving customer satisfaction and sales.
- Customer 360: Building comprehensive, 360-degree profiles of customers by integrating data from various touchpoints, enabling more personalized and effective customer interactions.
- Customer Insights: Gaining deeper insights into customer preferences and behaviors, allowing businesses to tailor their strategies and offerings to meet the unique needs of their customers.
Uncovering Hidden Networks
Graphs can uncover hidden networks and relationships that are crucial for detecting and preventing fraudulent activities. The applications include:
- Fraud Detection: By analyzing complex transaction networks, graphs can identify unusual patterns and suspicious activities, enhancing the accuracy of fraud detection systems.
- Entity Resolution: Graphs can consolidate data from various sources to resolve ambiguities and correctly identify entities, improving data quality and reliability.
- Know Your Customer (KYC): Enhancing KYC processes by integrating diverse data points to build comprehensive profiles of customers, ensuring compliance and reducing risk.
- Anti-Money Laundering (AML): Identifying and analyzing intricate financial networks to detect and prevent money laundering activities, ensuring regulatory compliance and safeguarding financial institutions.
Making Faster Decisions
Graphs enable more agile and informed decision-making by providing a comprehensive view of interdependencies and relationships. Key applications include:
- Supply Chain Management: Enhancing visibility across the supply chain by mapping out complex relationships between suppliers, manufacturers, and distributors, leading to more efficient and responsive supply chain operations.
- Inventory Management: Optimizing inventory levels and reducing waste by understanding the relationships and dependencies between different inventory items and their usage patterns.
- Digital Twins: Creating digital replicas of physical assets with detailed interdependencies, enabling better monitoring, simulation, and optimization of operations.
Augmented Intelligence: Combining Graphs with Generative AI
The integration of Graphs with Generative AI creates a powerful synergy, hereby defined as augmented intelligence. This approach enhances GenAI systems by providing contextualized business reasoning, leading to interpretable, explainable, and ethically responsible AI outcomes. Moreover, it democratizes access to data-driven insights, ensuring that the users can comprehend and leverage them effectively.
Graphs improve contextual understanding by capturing relationships between entities, which allows the AI systems to retrieve contextually relevant information from diverse knowledge sources. This enriched context enhances the relevance and accuracy of AI responses, making the systems more effective in handling complex queries and providing valuable insights and enabling users to ask direct queries and receive complete answers based on the enterprise data landscape. Drawing on verified and specialized knowledge sources, AI delivers more accurate and relevant information crucial for high-stakes decision-making processes where precision and reliability are paramount.
By combining the strengths of graphs with the generative power of LLMs, organizations can develop AI systems that not only perform exceptionally well but also adhere to high standards of transparency and ethical responsibility. This synergy supports better decision-making, strategic planning, and operational efficiency, ultimately leading to more informed and reliable outcomes.
Practical Enterprise-Ready Implementation
Implementing the advanced approach of combining graphs with generative AI involves a well-defined data governance pipeline. This process ensures that data is accurately integrated, contextually enriched, and ethically managed. The key components of this pipeline include:
- Data Integration from Domain Experts:
- Collection: Gather data from various sources, including databases, documents, and expert knowledge.
- Normalization: Standardize data formats to ensure consistency and compatibility.
- Validation: Verify the accuracy and reliability of the data through domain-experts review and automated checks.
- Annotation: Enrich the data with metadata and annotations that capture domain-specific knowledge and nuances.
- Graph Creation:
- Modeling: Design the schema of the Graph to represent entities, relationships, and attributes relevant to the domain.
- Population: Ingest data into the Graph, linking entities and establishing relationships based on the schema.
- Optimization: Optimize the Graph for performance, ensuring efficient querying and retrieval of information.
- Maintenance: Regularly update and refine the Graph to incorporate new data and improve accuracy.
- Vector Search Integration:
- Embedding Generation: Convert text, images, documents, and audio into high-dimensional vector embeddings using machine learning models.
- Indexing: Organize these embeddings in a vector database to enable fast and efficient similarity searches.
- Query Processing: Implement algorithms to compare user queries with the indexed embeddings, retrieving the most relevant information.
- Relevance Tuning: Continuously refine the search algorithms to improve the relevance and accuracy of search results.
- Application of Language Models:
- Model Selection: Choose appropriate LLMs that can interact with the Graph and vector search systems.
- Fine-Tuning: Customize the LLMs to align with the specific requirements and contexts of the enterprise.
- Integration: Seamlessly integrate the LLMs with the Graph and vector search to enable enriched and context-aware responses.
- Monitoring: Continuously monitor the performance of the models, ensuring they deliver accurate and reliable outputs.
- User Experience:
- Interface Design: Develop user-friendly interfaces that allow users to interact with the system easily and intuitively.
- Personalization: Implement features that personalize the user experience based on individual preferences and behavior.
- Feedback Mechanisms: Incorporate feedback loops that allow users to provide input on the system’s performance, which can be used to make ongoing improvements.
- Training and Support: Provide training and support to users to ensure they can effectively utilize the system and understand its capabilities.
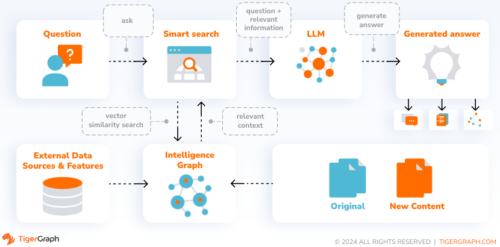
This image illustrates how these elements come together, providing a clear pathway from data ingestion to actionable insights. By structuring data governance in this manner, organizations can effectively manage their knowledge assets, ensuring accuracy, relevance, and ethical responsibility. This holistic approach not only enhances data quality and retrieval but also supports the creation of more transparent, interpretable, and responsible AI systems.
Conclusion
The integration of graph technology with generative AI represents a transformative step in AI development. By addressing critical challenges in privacy, bias, and contextual understanding, this approach enhances the transparency and responsibility of AI systems. As we advance, the continued focus on these principles will ensure that AI remains a force for positive and ethical progress in our data-driven world. The graph will be at the heart of this transformation, providing a stable foundation for leveraging human expertise in every aspect of business operations. This synergy of advanced AI and structured knowledge will pave the way for more reliable, responsible, and innovative solutions in the future.
 In today’s rapidly evolving business landscape, agility and efficiency are crucial for staying competitive. To achieve this, businesses rely on rules engines to automate decision-making processes efficiently and consistently. However, traditional rules engines often face challenges like complexity, slow adaptability, and high maintenance costs, hindering businesses from unleashing their true potential.
Enter TigerGraph’s Graph Rules Engine, a revolutionary approach to rule-based operations that empowers businesses to break free from the limitations of traditional rules engines. In this blog post, we will explore how TigerGraph’s cutting-edge technology has transformed the way two Forbes top 20 businesses operate, paving the way for enhanced performance, substantial cost savings, and unparalleled agility.
The Challenge of Traditional Rules Engines:
Traditional rules engines have long been the backbone of critical decision-making processes in various industries. Whether it’s product customization, customer eligibility, or asset maintenance, rules engines have provided businesses with the means to streamline operations. However, as businesses grow and evolve, these rule sets become increasingly complex, leading to a multitude of challenges:
- Slow to Adapt: Modifying rule sets can be a cumbersome and time-consuming process, leading to delayed responses to market changes and shifting business priorities.
- Difficult to Explain: Complex rules raise concerns about the confidence in individual decisions and the ability to explain their functioning, posing potential organizational risks.
- Expensive to Maintain: Traditional rules engines require a team of experts to maintain and update them, resulting in significant operational costs.
The Power of Graph Databases:
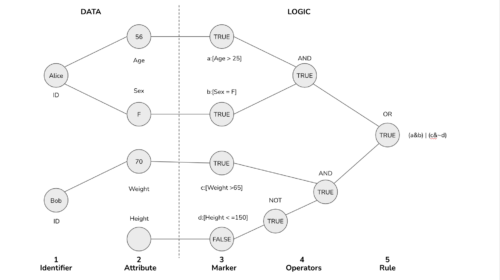
TigerGraph introduces a game-changing solution to these challenges by leveraging the potential of graph databases. Unlike traditional relational databases, a graph database structures information as networks of connected data points, allowing businesses to efficiently represent their products, customers, and operations. This unique approach enables a specialized network called a “tree of decisions,” wherein the rule tree connects seamlessly with the data graph as illustrated in this visual.
Key Benefits of TigerGraph’s Graph Rules Engine:
- Enhanced Manageability: By encoding logic as a graph, businesses gain a comprehensive overview of the interdependencies between various logical units. This visual representation simplifies the management of complex datasets and facilitates quick and confident decision-making.
- Rapid Adaptability: The graph-based approach allows for agile rule set modifications, enabling businesses to respond promptly to market changes and emerging edge cases.
- Cost-Effectiveness: With a simple, 30-line recursive program, TigerGraph’s Graph Rules Engine operates efficiently, reducing data transformation and minimizing system load. This results in improved data security, reduced latency, and cost savings in the maintenance process.
Success Stories:
TigerGraph’s Graph Rules Engine has already made a significant impact on two Forbes top 20 enterprises:
Global Top 5 Healthcare Insurer: By applying rules to determine the suitability of drugs for specific patients, the insurer saves millions of dollars by funding only the most cost-effective treatments.
Global Top 5 Technology Business: The company utilizes rules to ascertain product warranty coverage, leading to millions of dollars in savings through effective product repairs and improved aftermarket service.
TigerGraph’s Graph Rules Engine has revolutionized the way businesses approach rule-based operations. By leveraging the power of graph databases, businesses can overcome the limitations of traditional rules engines, achieving unmatched agility, cost-effectiveness, and operational efficiency. As demonstrated by two Forbes top 20 enterprises, TigerGraph’s innovative solution is a game-changer in today’s dynamic business environment. To experience the power of TigerGraph’s Graph Rules Engine, businesses can explore the options of cloud or on-premises deployment. Reach out to info@tigergraph.abstage.xyz to explore how your business can benefit.
Many graph use cases require fuzzy matching, a method used to find similar, but not exactly matching, phrases in a database. Some examples of fuzzy matching include inputting a string of characters, searching records with similar string attribute values, or finding a set of data records that have similar string values. Fuzzy matching is valuable in entity resolution, where data like first and last names needs to be identified and matched. In anti-fraud use cases, fuzzy matching can be used to match unstandardized addresses on credit card applications.
In a graph data structure, performing string fuzzy matches is challenging because:
- With the graph data structure, it’s simple to perform an exact match with vertices created using the string values as their ID; however, it’s challenging to introduce a connection for a fuzzy match
- Introducing additional components to the architecture using some indexing and search engines would solve the problem. This approach increases the system maintenance workload and the complexity of updating and querying the data.
By utilizing the MinHash approach during the graph loading process, vertices with similar string attribute values can be indirectly connected through common intermediary vertices whose IDs are the MinHash signature values. This approach has the following advantages:
- It doesn’t rely on additional architecture
- Performance is maintained by only scanning the relevant vertices without having to scan a large population of vertices
- Values are stored natively in the graph database in the form of vertices and edges, so the required data structure is automatically partitioned and distributed
- Search is done through graph traversal, which means we can adopt different algorithms to evaluate the string distance.
- All searches are automatically parallelized.
What is MinHash?
MinHash is a technique for evaluating string similarities. MinHash can reduce each string into fixed dimensions, which is a set of MinHash signatures. By calculating the Jaccard Similarity of the MinHash signature sets of different strings, we can get the string similarity.
It takes the following steps to calculate the MinHash Signatures:
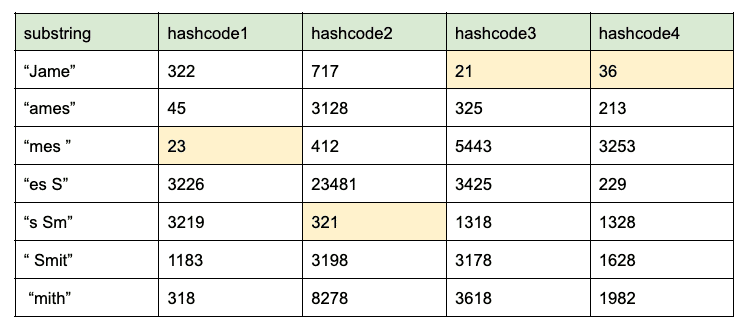
- Calculate the k-shingle of a given size k of a string. The k-shingle of a string is all possible consecutive substrings of length k. For example, the k-shingle with k value equals 4 of string, “James Smith” is {“Jame”, “ames”, “mes ”, “es S”, “s Sm”, “ Smit”, “mith”}
- Hash each substring into j integer hash codes with j different hash functions. For example, if j equals 4:

- The set minimum hashcode value for each hash code is 23, 321, 21, and 36. Therefore, the MinHash signature of string “James Smith” is {23, 321, 21, 36}
How Does MinHash Work on Graph?
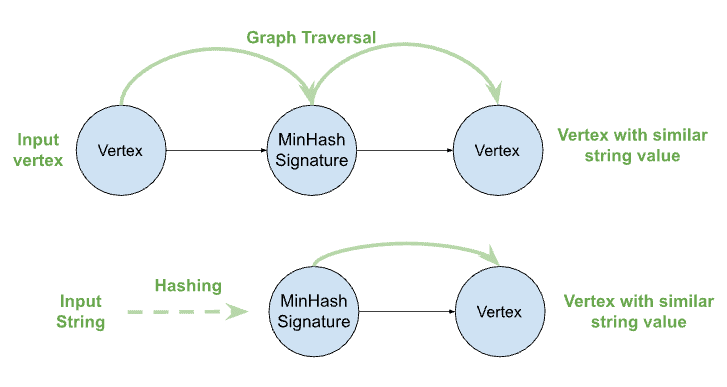
In the graph-based solution, for any given strings that will be used for the fuzzy match, we will first calculate the MinHash signatures, then create vertices using the Minhash signatures as the vertex ID. From there, we’ll connect the vertices that own the string values to those corresponding MinHash signature vertices.
This way, the MinHash signature vertices can be used to match the vertices having similar string values. For example, given a vertex, to find the vertices with similar string values, we just need to traverse to the intermediary MinHash signature vertices first, then from the MinHash signature vertices to the other connected vertices. This way without having to scan all the vertex populations, the vertices with similar string values can be found through graph traversal through the Minhash signature vertices.
In the same way, we can also convert any input string into MinHash signatures to allocate the MinHash signature vertices in order to find the vertices with similar string values to the input string.
The Workflow on TigerGraph
TigerGraph is a massively parallel processing graph analytical platform. Implementing the MinHash fuzzy match on TigerGraph is possible by taking the following steps.
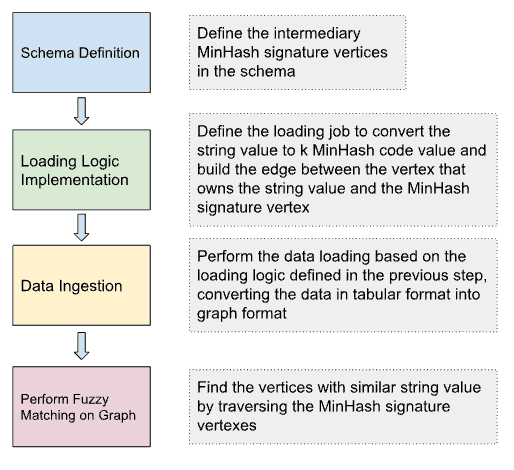
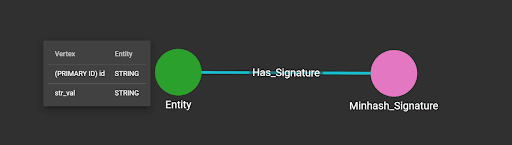
Schema Definition
In the graph schema, define the vertex type for MinHash signature and edge type between the entity that owns the string attribute and the MinHash signature vertex.
Loading Jobs
The loading job converts the strings to be matched into k MinHash signatures values, the number k is a configurable number of hash functions that will be used in the MinHash process. To do this, a TokenBank function is used. The complete tokenbank.ccp file can be found here.
The input to the TokenBank function is the string value for the fuzzy matching and the value of k and j. In our example, k=3 and j=10. The output of the TokenBank function is the MinHash signature delimited by “|”. With the output, the flatten function of the loading job is used to load the split string into a temp_table.
PUT TokenBank FROM "TokenBank.cpp"use graph MinHash
drop job load_hash
CREATE LOADING JOB load_hash FOR GRAPH MinHash {
DEFINE FILENAME MyDataSource;
LOAD MyDataSource TO TEMP_TABLE t1(vertexID, signature, stringvalue) VALUES($0, FLATTEN(minHash($1,”3″,”10″), “|”, 1), $1) USING SEPARATOR=”,”, HEADER=”false”, EOL=”n”;
LOAD TEMP_TABLE t1 TO EDGE Has_Signature VALUES($”vertexID”, $”signature”),
TO VERTEX Entity VALUES($”vertexID”, $”stringvalue”);
}
run loading job load_hash using MyDataSource=”data.csv”
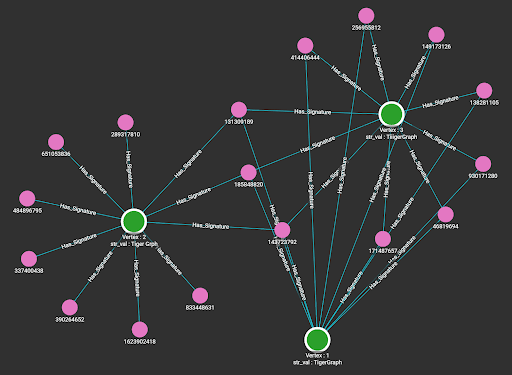
By executing the script above, the data below is ingested.
1,TigerGraph
2,Tiger Grph
3,TiiigerGraph
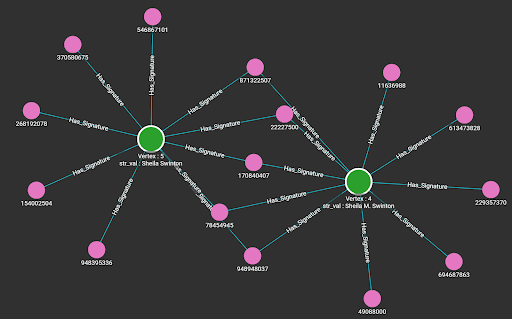
4,Sheila M. Swinton
5,Sheila Swinton
6,Beverly Farmer
7,Bev Farmer
8,Crystal Pablo
9,Chrissy PabloData Loading
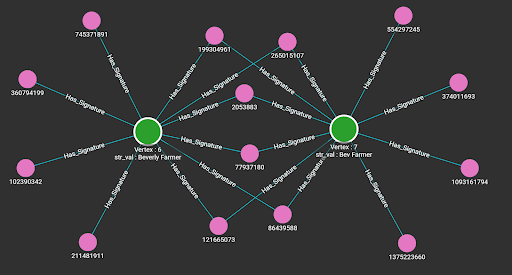
By running the loading jobs, the edges between the entity that owns the string attribute and the MinHash signatures of the string value are connected. Below are the visualization results from the Explore Graph page.
Queries
To perform the fuzzy match between vertices, either apply Jaccard Similarity or directly use the Jaro–Winkler distance expression function. The Jaccard Similarity approach will calculate the topological similarity based on the number of common MinHash signature vertices between the vertices to be matched. Because we only have a limited number of MinHash signatures, the result of the Jaccard Similarity will be approximate. To obtain an accurate string similarity, the string distance function is recommended.
Below is the query utilizing the string distance function that takes a vertex as input and returns the vertices that have similar strings, ordered by the similarity.
CREATE QUERY string_distance(VERTEX input) FOR GRAPH MinHash {SumAccum @similarity;
STRING val;
start = {input};
signatures = SELECT t FROM start:s-(Has_Signature)-:t
POST-ACCUM val = s.str_val;
matches = SELECT t FROM signatures:s-(Has_Signature)-:t
WHERE t != input
ACCUM t.@similarity += jaroWinklerDistance(val, t.str_val)
ORDER BY t.@similarity DESC;
print matches;
}
Result when taking vertex 1 as input.
[
  {
    "matches": [
      {
        "attributes": {
          "@similarity": 9.55556,
          "str_val": "TiiigerGraph"
        },
        "v_id": "3",
        "v_type": "Entity"
      },
      {
        "attributes": {
          "@similarity": 2.88,
          "str_val": "Tiger Grph"
        },
        "v_id": "2",
        "v_type": "Entity"
      }
    ]
  }
]
Below is the single source Jaccard Similarity query from the Graph Data Science Library.
CREATE QUERY tg_jaccard_nbor_ss (VERTEX source, STRING e_type, STRING rev_e_type,
 INT top_k = 100, BOOL print_accum = TRUE, STRING similarity_edge_type = "", STRING file_path = "")  SYNTAX V1 {
/*
Calculates the Jaccard Similarity between a given vertex and every other vertex.
Jaccard similarity = intersection_size / (size_A + size_B – intersection_size)
Parameters:
source: start vertex top_k: #top scores to report
e_type: directed edge types to traverse print_accum: print JSON output
rev_e_type: reverse edge types to traverse file_path: file to write CSV output to
similarity_edge_type: edge type for storing vertex-vertex similarity scores
This query current supports only a single edge type (not a set of types) – 8/13/20
*/
SumAccum @sum_intersection_size, @@sum_set_size_A, @sum_set_size_B;
SumAccum @sum_similarity;
FILE f (file_path);
Start (ANY) = {source};
Start = SELECT s
FROM Start:s
ACCUM @@sum_set_size_A += s.outdegree(e_type);
Subjects = SELECT t
FROM Start:s-(e_type:e)-:t;
Others = SELECT t
FROM Subjects:s -(rev_e_type:e)- :t
WHERE t != source
ACCUM
t.@sum_intersection_size += 1,
t.@sum_set_size_B = t.outdegree(e_type)
POST-ACCUM
t.@sum_similarity = t.@sum_intersection_size*1.0/(@@sum_set_size_A + t.@sum_set_size_B – t.@sum_intersection_size)
ORDER BY t.@sum_similarity DESC
LIMIT top_k;
IF file_path != “” THEN
f.println(“Vertex1”, “Vertex2”, “Similarity”);
END;
Others = SELECT s
FROM Others:s
POST-ACCUM
IF similarity_edge_type != “” THEN
INSERT INTO EDGE similarity_edge_type VALUES (source, s, s.@sum_similarity)
END,
IF file_path != “” THEN
f.println(source, s, s.@sum_similarity)
END;
IF print_accum THEN
PRINT Others[Others.@sum_similarity];
END;
}
Result when taking vertex 1 as input.
[
  {
    "Others": [
      {
        "attributes": {
          "Others.@sum_similarity": 0.17647
        },
        "v_id": "2",
        "v_type": "Entity"
      },
      {
        "attributes": {
          "Others.@sum_similarity": 1
        },
        "v_id": "3",
        "v_type": "Entity"
      }
    ]
  }
]
Below is the query that takes a query string as input, and returns the vertices that have a similar string value.
CREATE QUERY query_by_string(string query_str) FOR GRAPH MinHash {SetAccum @@min_hash_signatures;
SetAccum @@signatures_vertex;
SumAccum @similarity;
@@min_hash_signatures = minHash(query_str,3,10);
@@signatures_vertex = to_vertex_set(@@min_hash_signatures, “Minhash_Signature”);
start = @@signatures_vertex;
start = SELECT t FROM start:s-(Has_Signature)-:t
POST-ACCUM t.@similarity += jaroWinklerDistance(query_str, t.str_val)
ORDER BY t.@similarity DESC;
print start;
}
Below is the result of running the query above with input ‘tigergraph.’
{
    "start": [
      {
        "attributes": {
          "@similarity": 0.86667,
          "str_val": "TigerGraph"
        },
        "v_id": "1",
        "v_type": "Entity"
      },
      {
        "attributes": {
          "@similarity": 0.82222,
          "str_val": "TiiigerGraph"
        },
        "v_id": "3",
        "v_type": "Entity"
      },
      {
        "attributes": {
          "@similarity": 0.8,
          "str_val": "Tiger Grph"
        },
        "v_id": "2",
        "v_type": "Entity"
      }
    ]
  }
Conclusion
This blog introduced a way of running string fuzzy matches on graphs that is very performant, storage efficient, and easy to implement. The proposed approach doesn’t have to rely on additional infrastructure and can fulfill the need for both similar string value matching between vertices and fuzzy searching of vertex attribute values.
If you have any questions about this approach or using other graph algorithms or functions, we encourage you to join our TigerGraph Developer Community. On the community, you’ll find a collection of your peers, TigerGraph users from around the world, and our own graph experts, all of whom are committed to sharing their knowledge in an open, interactive forum.
3636 Nobel Dr. Suite 100
San Diego, CA 92122, USA