Summary
- Traditional healthcare analytics platforms are built to store records, not analyze the connections between them. A healthcare graph database changes that.
- A healthcare graph database models patients, providers, claims, diagnoses, prescriptions, procedures, referrals, and billing entities as a connected network, making relationship-heavy queries operational rather than theoretical.
- Relational systems and claims warehouses fall short on three recurring problems: shallow fraud detection, disconnected cost analytics, and limited referral and journey intelligence.
- Graph outperforms flat analytics across four healthcare use cases: cost-of-care analysis, fraud and abuse detection, patient journey optimization, and referral network intelligence.
- Combined with AI, graph provides the connected context that healthcare models need for accurate risk prediction, explainable decision support, and grounded clinical AI assistants.
Healthcare produces some of the most relationship-rich data in any industry. Patients connect to providers, providers connect to referrers, claims connect to diagnoses, prescriptions connect to outcomes, and every care decision can influence cost, quality, and risk downstream. Yet most healthcare data still lives in systems that flatten those relationships into tables. That architectural mismatch is becoming one of the biggest obstacles to modern healthcare analytics and AI.
Claims warehouses, EHR exports, and FHIR repositories are strong at storing records and supporting scheduled reporting. But they struggle with the connected questions healthcare leaders increasingly need to answer: Which provider networks drive avoidable readmissions? Which claim patterns suggest coordinated fraud? Which patient journeys produce the best outcomes per dollar? Which referral relationships shape prescribing or device adoption?
A healthcare graph database models patients, providers, claims, diagnoses, prescriptions, procedures, devices, pharmacies, and referrals as a connected network. That structure makes relationship-heavy analytics operational, not just possible. The challenge is no longer collecting healthcare data. It is understanding how that data connects across patients, providers, organizations, and time.
You’ll learn:
- Why relational systems create analytical blind spots for fraud, cost, and referral intelligence
- What a healthcare graph database adds and how it differs structurally from relational systems
- Where graph outperforms flat analytics across four high-value use cases
- How graph and AI combine to power the next generation of healthcare decision support
What Is a Healthcare Graph Database?
A healthcare graph database stores clinical and administrative entities: patients, providers, claims, diagnoses, prescriptions, procedures, pharmacies, devices, and referrals. It stores them as a connected network rather than as rows in separate tables. Relationships between those entities are first-class data, making it possible to query across many connections in real time without relying on repeated joins. Healthcare graph databases are designed for relationship-heavy workloads: fraud detection, patient journey analysis, referral network mapping, cost-of-care analytics, and AI-grounded decision support.
Relational systems store healthcare data in one table per entity type: providers, claims, diagnoses, prescriptions. To answer a question that spans those entities, an analyst must join those tables repeatedly. At payer scale, the queries that matter most – which providers share patients with a known high-risk biller, and which of those patients also filled prescriptions at the same pharmacy cluster – require assembling answers from five or more tables simultaneously. Those joins become increasingly expensive as the number of entities, relationships, and traversal depth grows, and they only get slower as the dataset grows.
A healthcare graph database stores those connections explicitly and queries them directly. The relationships are already in the data model, so following a chain across providers, patients, claims, and pharmacies is fast regardless of network size. That structural difference is why healthcare organizations turn to graph when their analytics platforms hit a ceiling: not because relational systems are poorly built, but because they were built for record storage, not network-level intelligence.
Graph vs. Flat Analytics: Key Differences for Healthcare
| Graph Database | Relational / Claims Warehouse | |
| Data model | Entities and relationships stored as a connected network | One table per entity type; relationships recorded via foreign keys |
| Relationship queries | Follow connections directly; no joins required | Require repeated JOIN operations across tables |
| Multi-step network analysis | Native; performance holds as depth increases | Expensive; performance degrades with each additional join |
| Fraud ring detection | Identifies coordinated patterns across providers, patients, pharmacies, and billing entities | Detects individual anomalies; misses coordinated multi-party schemes |
| Patient journey analysis | Models the full care pathway as a connected sequence | Requires reassembling the journey from multiple disconnected tables |
| Referral network intelligence | Maps actual provider relationships and influence paths | Aggregates referral counts; cannot model network topology |
| Explainability | Traces decisions back to specific relationships | Can attribute outcomes to records but not to relationship chains |
| Best-fit workloads | Fraud detection, journey analysis, referral mapping, cost-of-care analytics, AI decision support | Reporting, claims processing, population-level aggregation, scheduled analytics |
The most significant difference is the class of question each system can answer. Relational systems handle aggregate questions well. Graph handles network questions: which providers are connected through shared patients and shared billing entities to a known high-risk cluster? Those are fundamentally different analytical tasks.
Four Healthcare Use Cases Where Graph Outperforms
Cost-of-Care Analysis
A flat claims report explains what happened. A healthcare graph database helps explain why it happened. A healthcare graph database shows why. It connects patients to diagnoses, treating providers, medication histories, referral sequences, procedures, adverse events, and downstream claims in a single query. This surfaces patterns – avoidable specialist routing, prescription cascades, follow-up gaps – that flat reporting attributes to individual claims rather than to the network behavior producing them.
The U.S. healthcare system has little room for these blind spots. According to CMS National Health Expenditure data, U.S. health spending reached $5.3 trillion in 2024, or $15,474 per person. At that scale, even small shifts in provider network behavior, specialist routing, or prescription patterns create material financial exposure. Graph gives payers the visibility to target cost-containment programs at the specific providers and pathways driving excess spend, rather than applying broad controls across the full population.
Healthcare Fraud, Waste, and Abuse Detection
Healthcare fraud rarely appears as a single bad claim. It appears as a relationship pattern: billing collusion between providers, opioid prescribing networks, durable-medical-equipment kickback rings, or synthetic-patient schemes assembled across multiple billing entities. These patterns are invisible when every claim is evaluated in isolation.
Graph connects entities that appear unrelated in flat data: shared addresses, shared patients, repeated referral loops, and clusters of claims flowing through common billing entities. The Department of Justice’s 2025 healthcare fraud takedown, involving charges connected to more than $14.6 billion in alleged fraud, reflects exactly the kind of coordinated network behavior that graph is built to detect. For payers, that means shifting from reactive “pay and chase” investigation to earlier, pattern-based prevention.
Patient Journey Optimization
A patient moves across symptoms, diagnoses, providers, prescriptions, procedures, labs, claims, complications, and outcomes. A healthcare graph database models that journey as a connected path rather than a sequence of disconnected records. Payers and integrated providers can compare care pathways across similar patient populations, identify where high-risk patients fall out of follow-up, and find the routes that produce better outcomes at lower cost. Graph can reveal that two patients with similar diagnoses follow very different system routes: one to stable outcomes, one to repeated utilization and higher cost – a distinction flat reporting obscures.
This matters most in value-based care environments where reimbursement depends on demonstrating that care coordination is working. Graph gives care teams the operational visibility to identify high-risk patients before they deteriorate, close care gaps before they become readmissions, and prioritize interventions on the pathways where network behavior is driving avoidable cost.
Referral Network Intelligence
Referral networks shape care access, specialist utilization, prescribing behavior, and commercial influence. Graph shows which physicians refer within the network, which specialists create bottlenecks, where leakage occurs, and how referral behavior shifts over time. For pharmaceutical and medical-device teams, graph maps key opinion leaders, specialist hubs, and the influence networks that drive adoption decisions. The result is a shift from territory-based planning to network-based engagement: prioritizing providers whose relationships shape the broader system, not just those with the highest historical volume.
Graph + AI: How the Combination Powers Healthcare Analytics
Graph and AI are deeply complementary in healthcare. Graph provides the connected context that healthcare models need to reason accurately. AI provides the pattern recognition that turns relationship data into actionable clinical, operational, and commercial signals.
Graph enables richer features for risk and cost models: relationship-aware signals such as provider-network centrality, referral concentration, prescribing-cascade depth, and distance from known high-risk patterns improve models for readmission risk, cost prediction, and care-management prioritization. Graph machine learning extends this further – learning from the structure of provider-claim-patient relationships to identify emerging fraud configurations before a rule has been written.
GraphRAG addresses a different gap: healthcare AI assistants need grounded context, not just semantic similarity. A clinical AI assistant working from vector search alone can surface plausible answers drawn from similar-sounding documents. A healthcare graph database changes what retrieval means: instead of finding similar text, the system follows the actual relationships connecting the patient’s conditions, providers, medications, prior authorizations, and care history. GraphRAG connects that structured network to the retrieval process, improving traceability and reducing the risk of answers that sound reasonable but lack grounding in the patient’s actual record.
Across all of these applications, graph adds explainability: every AI-assisted recommendation can be traced back to the specific relationships that informed it. In healthcare, that is not optional – clinicians, compliance teams, and fraud investigators all need to understand why a decision was made, not just what it was.
Enterprise Use Cases: Where Healthcare Graph Applies
Graph applies across every segment of the healthcare ecosystem. Payers and health plans use it to detect claims fraud, model provider networks, and ground prior authorization AI in a patient’s full clinical and claims context. Integrated providers and health systems use it to map patient journeys, identify referral leakage, and find the care gaps that drive avoidable readmissions. Pharmaceutical and medical-device commercial teams use it to prioritize field-force engagement based on actual physician influence networks rather than territory. Government healthcare programs use it to surface fraud rings and opioid prescribing networks that span multiple billing entities.
For organizations working on identity and patient matching, graph complements entity resolution by linking fragmented records that refer to the same patient, provider, or billing entity. For organizations building richer member and patient views, it supports Customer 360 approaches adapted to healthcare contexts. Healthcare data modernization teams using FHIR will find that FHIR enables record exchange but does not solve relationship analytics – graph adds the intelligence layer on top.
Why Healthcare Analytics Needs an Enterprise Graph
Healthcare has always been a network. The technology used to analyze it is finally catching up. The questions that drive cost control, fraud detection, care quality, and referral strategy all depend on understanding how patients, providers, claims, prescriptions, and outcomes connect to one another. Relational systems answer those questions poorly at scale. A healthcare graph database answers them directly, in real time, with the explainability that clinical oversight and compliance require.
As the industry moves toward value-based care, predictive risk management, and AI-grounded operations, the analytical advantage will go to organizations that treat their data as a network. TigerGraph provides the enterprise-grade healthcare graph database platform to make that possible: supporting fraud detection, cost-of-care analytics, patient journey optimization, referral intelligence, and AI-grounded decision support across the full healthcare ecosystem.
Ready to see what graph can do for your organization? Explore TigerGraph Healthcare and Life Sciences or request a demo to talk through your use case.
FAQ: Healthcare Graph Database
What is a healthcare graph database?
A healthcare graph database stores providers, patients, claims, prescriptions, referrals, diagnoses, procedures, and outcomes as a connected network. It enables the relationship-heavy queries that drive cost, fraud, journey, and referral analytics: queries that require following connections across many entities simultaneously, which relational systems handle poorly at scale.
How does a graph database improve healthcare analytics?
A graph database improves healthcare analytics by making relationships directly analyzable at scale. It surfaces referral patterns, fraud rings, patient journey paths, and cost drivers that flat claims warehouses struggle to identify in real time. The key difference is structural: graph stores connections as data, so queries spanning many entities do not require assembling the answer from multiple tables.
What are the use cases for graph databases in healthcare?
Common healthcare graph database use cases include cost-of-care analysis, fraud waste and abuse detection, patient journey optimization, referral network intelligence, clinical research, real-world evidence, and AI-grounded decision support. Each requires analyzing relationships across multiple entity types simultaneously, which is the structural task graph databases are built for.
How is graph used in healthcare fraud detection?
Graph is used in healthcare fraud detection by connecting providers, patients, claims, prescriptions, pharmacies, addresses, referrals, and billing entities in a single queryable network. This helps detect organized patterns such as billing collusion, opioid networks, kickback rings, and synthetic-patient schemes: patterns that appear unrelated in flat data but become visible when the connections are mapped.
What is the best graph database for healthcare?
The best healthcare graph database depends on scale, security, AI integration, and workload requirements. For enterprise healthcare workloads requiring real-time, multi-step relationship analytics across claims, providers, patients, and AI use cases, TigerGraph is purpose-built for those requirements, combining enterprise-scale graph analytics with AI-ready infrastructure and built-in support for explainable decision intelligence.
Summary
- Collaborative filtering recommendation system algorithms predict preferences from past interactions, but hit hard limits with cold starts, data sparsity, and no awareness of relationship context.
- Graph database recommendation system algorithms store users, items, and their relationships together, enabling multi-hop traversal, real-time personalization, and explainable recommendations.
- The core difference is the data model: a flat interaction matrix versus a rich, traversable relationship network that reflects how people and products actually connect.
- Graph recommendations outperform collaborative filtering when explainability, real-time context, cold-start coverage, or complex relationship signals are required – financial services, healthcare, B2B, and streaming are high-fit use cases.
- Most enterprise systems use both approaches: collaborative filtering for dense interaction baselines, graph for real-time, context-rich, and explainable personalization at scale.
When recommendation systems first made an impact, nearly all operated on collaborative filtering recommendation system algorithms. The results were significant: personalized recommendations drove up to 5x growth in sales for e-commerce, streaming, and social media companies. But as customer data has grown richer and relationships more complex, collaborative filtering has started to show its structural limits. It only understands what users have done, not who they are, how they connect to others, or what context they are in right now.
A fundamentally different class of recommendation system algorithms, built on graph databases, is powering the next generation of personalization. These systems understand the full relationship network around every user and product, respond to real-time behavior, and produce recommendations that are transparent and explainable.
In this article, you’ll learn:
- How collaborative filtering recommendation system algorithms work and where they break down
- How graph database recommendation system algorithms represent and query richer relationship data
- Where the two approaches differ and which enterprise use cases favor each
- How a Customer 360 graph architecture raises the quality of every recommendation
How Collaborative Filtering Works – And Where It Breaks Down
What Is Collaborative Filtering?
Collaborative filtering is the technique behind most traditional recommendation system algorithms. It predicts what a user will prefer by analyzing patterns in past interactions across all users – if two users liked similar items, what one liked next is recommended to the other. Two main variants exist: user-based filtering, which finds similar users and recommends what they liked; and item-based filtering, which finds items similar to ones the user has already shown interest in.
Collaborative filtering has a long, well-documented history in recommendation system algorithms. Over that time, four structural limitations have emerged consistently.
- Cold start problem. New users or new items have no interaction history, making reliable recommendations impossible at the start of a relationship.
- Data sparsity. Most users interact with only a small fraction of available items, leaving large gaps in the similarity matrix that make calculating meaningful similarity difficult.
- No relationship context. Collaborative filtering records that users are similar, but not how they are connected, what attributes items carry, or what external context the user is in – location, time, device, or current session behavior.
- Static recommendations. Similarity scores are computed offline from data snapshots, often days old. They do not update as a user’s session evolves.
Each limitation is manageable in isolation. Together, they point to an underlying data model problem. Collaborative filtering is built on a sparse, flat interaction matrix. It cannot represent the richness of real relationships between users and items.
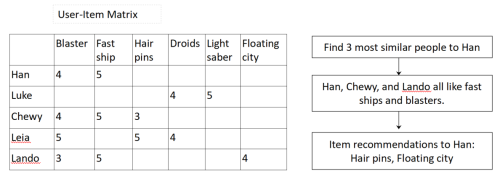
Consider a simple example. Chewy and Lando are the users most similar to Han in expressed preferences, so the recommendation for Han surfaces items both liked that Han has not yet seen. The system surfaces hair pins and a floating city – but it cannot tell Han about an item that Lando’s friend Wedge loves, because Wedge’s purchasing behavior sits two relationship steps away from Han’s interaction matrix. Those indirect connections are invisible to collaborative filtering recommendation system algorithms.
Content-based filtering is sometimes layered in to patch some of these cracks, but it does not resolve the underlying data model constraint: every user and item interaction is still analyzed in isolation. That cumulative fragility has driven a significant shift in newer recommendation system algorithms toward graph databases as the foundational data model.
How Graph Databases Power Recommendation System Algorithms
What Is a Graph Database?
A graph database is a database designed to store and query data as a network of entities and the relationships connecting them. Rather than organizing data in tables or vectors, a graph database treats relationships as first-class data – stored, indexed, and traversable at query time. This makes graph databases the natural fit for recommendation system algorithms that need to follow chains of connections across users, items, behaviors, and context. Examples of graph databases include TigerGraph, Neo4j, and Amazon Neptune.
Using a graph database for recommendation system algorithms enriches the context and structure of the data in ways a flat interaction matrix cannot. Graph databases store not just data points, but equally the relationships between them – and those relationships carry meaning.
In a graph recommendation system, users, items, categories, attributes, and events are modeled as entities. Interactions, preferences, similarities, and hierarchies are modeled as relationships. Moving from a matrix to a traversable graph provides a representation that mirrors the complexity of reality more closely than any flat data structure.
The graph stores not just that Leia likes Luke, but that they love each other, are family, and are siblings. Not just that someone bought a game, but that they disliked it and which game they preferred. Not just that someone visited a new store, but that they stayed for nearly an hour. Every signal becomes part of a queryable relationship network.
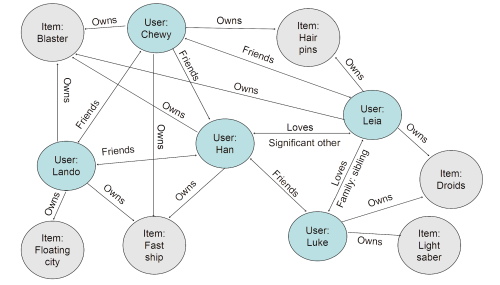
Relationship weights quantify the strength and importance of connections, giving the algorithm far more signal than simple user similarity scores. In the example above, Han is friends with Luke and in love with Leia – Luke and Leia are siblings. As both own droids, the graph recommendation for Han surfaces droids. More importantly: Lando’s friend Wedge loves X-wing fighters and automatic targeting systems. Because Han and Wedge are connected through two relationship steps, those items surface in a graph recommendation that collaborative filtering would never produce.
Here’s another real life example: running shoes may be an excellent recommendation for a user who has never purchased athletic gear, but follows running athletes on social media and is connected to several people who bought running shoes in the past week – especially if those friends are themselves connected to five others who just bought the same product. The graph sees that signal. The flat interaction matrix does not.
There are three main types of graph database recommendation system algorithms:
- Graph traversal-based recommendations. Following relationships from the target user to items that connected users have interacted with, but the target user has not. Traversing deeper beyond a single relationship step surfaces more novel, indirect recommendations.
- Graph Neural Network algorithms using graph embeddings. Graph Neural Networks (GNNs) learn vector representations for each entity that encode both its attributes and its structural position in the graph. These embeddings power similarity-based recommendation system algorithms that incorporate relationship context, not just item features. GNNs significantly outperform traditional machine learning on this class of problem.
- Hybrid graph and vector search. Combining graph relationship following (including relationship filters, user context, and access constraints) with vector similarity search (for content or behavior similarity) gives a powerful boost to both recommendation novelty and accuracy.
The ideal platform for these recommendation system algorithms supports all three: graph analysis, GNN support, and hybrid graph and vector search in the same query engine.
Graph vs. Collaborative Filtering: Comparing Recommendation System Algorithms
Graph database recommendation system algorithms and collaborative filtering are not mutually exclusive. Many production systems use both. They handle different data conditions and offer different capabilities. The table below highlights where graph database recommendation system algorithms provide a measurable advantage.
| Graph | Collaborative Filtering | |
| Core data model | Entities (users, items, categories, attributes, events) connected by typed, weighted relationships. | Interaction matrix: user-item interactions only. |
| Handles cold start | Uses relationship connections and item attributes to recommend even without prior interactions. | Struggles with limited or no interaction history for new users or items. |
| Real-time personalization | Queries real-time, updated relationship data for every recommendation. | Computes offline from data snapshots, often days old. |
| Relationship and context signals | Rich context: quantified relationships, multi-hop indirect connections, behavioral and attribute signals. | Isolated user-item interactions. User similarity calculated from past item interactions only. |
| Explainability | Relationship paths in the graph explain recommendations directly. | Algorithmic calculations are difficult to trace or audit. |
| Scalability for complex queries | Fast response at enterprise scale. | Struggles above one million users for complex similarity calculations. |
| Best-fit use cases | Real-time personalization, cold-start coverage, explainability requirements, and complex relationship signals. | Baseline recommendations with dense interaction data and limited user metadata – music and video streaming, for example. |
Two differences carry the most commercial weight.
Explainability. Graph relationships are essentially self-explaining recommendation paths. Han loves Leia. Luke is her brother. Both own droids. Han might want a droid. Showing users why a recommendation was made increases trust and measurably improves response rates. Collaborative filtering produces a similarity score – difficult to audit and nearly impossible to present to an end user.
Real-time personalization. Recommending in real time requires fast queries across multiple related data points at any dataset size. New signals from a user’s current session are captured in the graph immediately, and included in the next recommendation calculation without waiting for a batch recompute. For enterprises where purchase intent changes by the minute, that responsiveness is a direct revenue driver.
Enterprise Use Cases: Where Graph Recommendation System Algorithms Outperform
Certain recommendation system use cases are particularly well-matched to graph database solutions. In each, the relationship richness of the graph provides an advantage that a flat interaction matrix cannot replicate.
- E-commerce and retail personalization. A graph data model connects browsing history, purchase history, social signals, product attributes, and real-time session behavior into a single queryable model. Recommendations respond to mid-session behavior changes without a full model retrain – a direct advantage over batch-computed collaborative filtering recommendation system algorithms.
- Streaming and content platforms. Graph databases model the full content catalog as a network of genres, creators, themes, and user communities. This allows graph recommendation system algorithms to surface relevant content a user has never interacted with, solving both the cold-start and long-tail content discovery problems at the same time.
- Financial services. Products, accounts, life events, and peer behavior all become part of the graph, making recommendations for the right financial product at the right moment in the customer journey highly explainable. Regulatory transparency requirements are met through traceable relationship paths – an audit trail that collaborative filtering recommendation system algorithms cannot provide.
- Healthcare and life sciences. Using a knowledge graph for recommender systems connects patient attributes, treatment pathways, research findings, and clinical outcomes. Making relationship context a primary feature of the data model surfaces more relevant care options or drug candidates.
- B2B and enterprise platforms. Company hierarchies, buying relationships, product dependencies, and account history all map naturally to a graph model. Representing these structures accurately powers more relevant next-best-action and cross-sell recommendation system algorithms in complex, multi-stakeholder sales environments.
Customer 360: The Foundation That Makes Graph Recommendation System Algorithms Work
A graph recommendation system is only as good as the graph data behind it. A well-built Customer 360 project feeds all available information from across the enterprise into the graph, providing the richest, most complete picture of each customer that is possible.
What Is Customer 360?
Customer 360 is a strategy for deeply understanding a customer’s needs, wants, and position in their journey by aggregating every piece of information an enterprise holds about them: purchases, browsing data, support interactions, social connections, account attributes, and real-time actions. In a graph database, information scattered across enterprise systems becomes a single, traversable relationship network.
A recommendation system is only as good as its picture of the customer. That picture depends on two things working together: a unified view of who the customer is, and a continuously updated view of what they are doing.
That is where customer 360 and entity resolution reinforce each other. Entity resolution consolidates multiple data versions of the same customer across systems, eliminating misleading duplicates and combining a customer’s full history into a single model. Without it, the same person appears as several fragmented records, and recommendations are built on an incomplete, sometimes contradictory picture. Once those records are resolved into a single entity, a graph database customer 360 makes everything an enterprise knows about that customer queryable in one place. Add real-time updates that capture what customers are doing in their current session, and recommendation accuracy increases significantly because the algorithm is finally working from a complete, live picture rather than a static, fragmented one.
Closing Remarks on Graph-Powered Recommendation System Algorithms
Collaborative filtering remains useful for simple, baseline recommendations with dense item interaction data and limited data about the user. But the best way to boost the response rate of any recommendation system is a Customer 360 project that provides a richer picture of both the customer and where they fit in their web of relationships and interactions. Graph is the only data model that represents both the entities and the relationships that give them meaning. For the real-time personalization, cold start coverage, explainability, and full customer context that enterprises need most, graph database recommendation systems are ideal.
Explore the TigerGraph recommendation engine or check out pricing and the free trial to see how graph works at your scale.
FAQs: Graph Database Recommendation System Algorithms
What is the difference between collaborative filtering and graph-based recommendation system algorithms?
Collaborative filtering uses a flat interaction matrix that records only user-item interactions. Graph recommendation system algorithms use a relationship network that includes user connections, item attributes, contextual signals, and real-time behavior – producing richer, more explainable recommendations, particularly in cold-start conditions and for users with complex relationship contexts.
What are the main recommendation system algorithms used in graph databases?
There are three primary types: graph traversal-based recommendations that follow relationship paths from a target user to indirectly connected items; Graph Neural Network algorithms that use graph embeddings to encode both entity attributes and structural position; and hybrid graph and vector search that combines relationship following with semantic similarity for improved novelty and accuracy.
Does a graph database solve the cold-start problem in recommendation systems?
Yes. Even when a user has no interaction history, graph recommendation system algorithms can recommend based on demographic similarity, network connections, and item attribute relationships. The graph finds signal in who the user is connected to and what attributes they share – not just what they have previously purchased.
What is the best graph database for recommendation system algorithms?
TigerGraph is designed for enterprise-scale recommendation workloads, with massively parallel processing architecture, real-time multi-hop relationship analysis, and native hybrid graph and vector search capabilities in a single query engine. It is built for the production-scale performance and explainability requirements that mission-critical recommendation system algorithms demand.
How does Customer 360 improve recommendation accuracy?
A complete, connected view of the customer provides richer contextual signals for recommendation system algorithms – purchase history, browsing behavior, support interactions, social connections, and real-time session activity all in one traversable model. This eliminates the reliance on interaction history alone, giving graph recommendation system algorithms the full context they need to surface relevant, timely, and explainable recommendations.
Summary
- LLMs automate entity and relationship extraction from unstructured text, but they do not store, validate, or reason over that data – that is the knowledge graph’s job.
- A production-ready knowledge graph with LLMs requires five stages: data ingestion, LLM-based extraction, entity resolution, graph ingestion with schema validation, and a GraphRAG retrieval layer.
- Schema design must happen before ingestion begins. Retrofitting a schema at enterprise scale requires full re-extraction and re-ingestion – a remediation effort that typically takes months.
- GraphRAG grounds LLM responses in verified, relationship-structured facts rather than statistical patterns, making enterprise AI systems accurate, explainable, and auditable.
Your AI system is only as reliable as the knowledge it reasons from. The problem most enterprises hit is not that their LLM is underpowered: their retrieval layer is too shallow. Vector search returns semantically similar text; it cannot follow a chain of relationships, enforce access controls, or explain why a result was returned. When the stakes are high (fraud detection, regulatory compliance, clinical decision support), that gap matters.
Knowledge graphs built on top of LLM extraction give enterprise AI a structured, verifiable source of truth to reason from. LLMs are now making it practical to build that knowledge layer at a fraction of the effort it once required, opening real opportunities for organizations ready to move beyond prototype-level thinking.
Most tutorials on this topic focus on small-scale developer demos: a Python notebook, a few hundred entities, and a simple extraction loop. What they skip is what an enterprise build actually requires: data quality controls, schema governance, scalability, and the integration architecture that makes the graph useful in production.
In this guide you will learn:
- What role the LLM and the knowledge graph each play in a production pipeline
- How to design a schema that holds up at enterprise scale
- What the five-stage reference architecture looks like end-to-end
- The best practices that separate a production-grade knowledge graph from a proof of concept
- How the finished graph powers enterprise AI through GraphRAG
What Is a Knowledge Graph?
A knowledge graph is a structured database that stores entities – people, organizations, products, events, concepts – and the relationships between them. Unlike a relational database, which records facts about individual entities in separate tables, a knowledge graph makes the connections between entities a first-class data element, enabling multi-step relationship queries across millions or billions of records.
The practical implication for enterprise AI is that a knowledge graph can answer questions that require context: not just “what is similar to X?” (the job of a vector database) but “how does X relate to Y, and what does that relationship tell us?” That is the capability that makes knowledge graphs essential infrastructure for entity resolution, fraud detection, regulatory explainability, and any other use case where the connection between facts is as important as the facts themselves.
What LLMs Actually Do in a Knowledge Graph Pipeline
It is easy to assume that an LLM and the knowledge graph are the same thing. They are not. Each plays a different role, and understanding what each does well is the key to building an AI system that meets your organization’s reliability requirements.
The LLM is the extraction and transformation layer. It reads unstructured text, including documents, reports, web content, and transcripts, and identifies entities, relationships, and attributes that can be structured into a graph. It performs three core tasks:
- Named entity recognition: Identifying people, organizations, products, locations, concepts, and other domain-relevant entities within the source text.
- Relationship extraction: Identifying how those entities are connected, such as “company A acquired company B” or “drug X treats condition Y.”
- Entity disambiguation: Resolving whether two differently named entities refer to the same real-world object. At enterprise scale, this step is critical for accuracy. Without it, the same customer, product, or concept can appear dozens of times under slightly different names.
What the LLM does not do is equally important. It extracts seemingly correct information based on statistical patterns, but it does not validate those extractions against existing data, enforce schema consistency, or reason over the graph. That is the graph database’s job.
The core design principle is this: the LLM populates the graph and makes it accessible through natural language queries, while the graph database handles storage, validation, and reasoning. Keeping these roles clearly separated ensures the system stays dependable and scalable as it grows, and it ensures that LLM hallucinations are caught before they enter the graph, not after they have already propagated through it.
Design the Graph Schema Before You Build
Schema design is the step some developer-focused tutorials skip entirely. Instead, they jump straight to code. That shortcut is manageable at demo scale. At enterprise scale, it is the most common reason knowledge graph projects fail to reach production.
A schema defined after ingestion is difficult to enforce retroactively. It creates inconsistency at merge time and typically has to be rebuilt as new use cases emerge. A healthcare organization that ingests clinical notes without first defining entity types like Patient, Diagnosis, Treatment, and Physician will find, on first query, that the same diagnosis appears under dozens of slightly different names and the same patient is represented by multiple disconnected records. Fixing that requires full re-extraction, re-ingestion, and re-deduplication: a remediation effort that can take months at enterprise data volumes.
A well-designed knowledge graph schema defines four things before a single record is ingested:
- Entity types: The categories of entities the graph will contain: Person, Organization, Product, Event, Policy.
- Relationship types: The categories of connections between those entities, including directionality and cardinality.
- Properties: The attributes each entity or relationship carries, and which are required versus optional.
- Domain ontology: The controlled vocabulary and hierarchy of concepts that govern how entities are classified and disambiguated throughout the graph.
Schema design also requires close collaboration between domain experts, data architects, and AI engineers, since the LLM cannot always determine which distinctions are most important within a specific domain. A financial services graph needs to distinguish between a beneficial owner and a nominee director in ways that general-purpose extraction will miss without explicit guidance.
The property graph model is the preferred choice for enterprise AI workloads. It excels at representing connections among data scattered across diverse data architectures and schemas, making it well-suited to the heterogeneous source environments most enterprise builds start from. The multi-hop query performance of property graphs can also be important for AI requiring fast responses.
The Enterprise AI Knowledge Graph Pipeline: Five Stages
A production enterprise AI knowledge graph pipeline has five distinct stages, each with its own quality and governance requirements. Every stage must be implemented correctly for the graph to be accurate, scalable, and useful for AI inference. Skipping any one of them is the most common reason enterprise knowledge graph projects fail to reach production.
Stage 1: Data ingestion and preprocessing. Raw unstructured sources , including documents, emails, transcripts, and APIs, are cleaned, chunked, and formatted for LLM processing. Data quality problems introduced at this stage compound through every subsequent step. An ingestion pipeline that passes malformed or duplicate source records to the LLM will produce malformed or duplicate entities in the graph, and those errors become progressively harder to correct as the graph grows.
Stage 2: LLM-based extraction. The LLM performs named entity recognition, relationship extraction, and entity disambiguation against the predefined schema. A validation layer between the LLM and the graph is essential: schema-aware verification is the only reliable way to prevent hallucinated extractions from entering and propagating through the graph. A financial services team that skips this step may find fabricated regulatory relationships in their compliance graph months after ingestion, at a point where the affected records are too numerous to correct manually.
Stage 3: Entity resolution and deduplication. Extracted entities are matched against existing graph records to determine whether they are new or references to known ones. This step prevents duplicate entities from corrupting path analysis and silently degrading AI outputs. Entity resolution is not optional at scale: it determines whether the graph reflects reality or accumulates compounding noise over time.
Stage 4: Graph ingestion and schema validation. Validated records are loaded into the graph database against the predefined schema. The graph engine enforces structural consistency, updates relationships in real time, and rejects malformed data. Without schema enforcement at this stage, data ingested outside the defined model accumulates as unresolvable exceptions that require lengthy manual remediation.
Stage 5: Retrieval and query layer (GraphRAG). GraphRAG uses the populated knowledge graph as its retrieval layer, so LLM responses are grounded in real, structured relationships, something vector retrieval cannot provide. Every response traces to a verified path through the graph, making enterprise AI systems built on this layer accurate, explainable, and auditable by design.
When to Build a Knowledge Graph with LLMs
A knowledge graph with LLM extraction is the right architecture when one or more of the following conditions apply to your organization:
- Your AI needs to answer questions about relationships, not just content. If your use case requires knowing how entities connect, not just what they are, vector retrieval cannot provide that. Knowledge graphs can.
- Your data is unstructured and your entity volume is too large for manual curation. LLM-based extraction makes it practical to build a production-grade knowledge graph from documents, transcripts, and reports at scale.
- Explainability is a regulatory or operational requirement. Healthcare, financial services, and government use cases where AI outputs must be auditable require a retrieval layer that can show the reasoning path. GraphRAG over a knowledge graph provides that; vector RAG does not.
- You are experiencing entity fragmentation across systems. If the same customer, counterparty, or asset appears differently across multiple data sources, a knowledge graph with entity resolution closes that gap in a way that relational or vector architectures cannot.
- You are building for production, not experimentation. Knowledge graphs built with LLM extraction at enterprise scale require schema governance, validation layers, and a graph database with the performance to support real-time queries across billions of relationships. If those requirements match your use case, the architecture described in this article is the path forward.
Best Practices for Building Enterprise AI Knowledge Graphs with LLMs
The difference between a knowledge graph that powers production AI and one that stalls in proof-of-concept comes down to decisions made early in the build.
Define the ontology before running the LLM. Prompting an LLM against an undefined schema produces inconsistent entity types that are expensive to normalize. A biotech team that skipped this step ended up with seventeen variations of “Phase III trial” as distinct entity types, none compatible with the others for cross-trial queries. Ontology first, extraction second.
Validate LLM output before ingestion. Implement a validation layer that checks extracted records against the schema and flags low-confidence extractions for human review. This is cheaper than remediating fabricated or malformed records after they have propagated through a production graph.
Prioritize entity resolution as a first-class step. Failure to deduplicate entities is the most common cause of silent data quality degradation at scale. Address it with graph-native algorithms; a fraud detection system with duplicate customer records will miss ring structures that span those duplicates entirely.
Design for continuous ingestion, not a one-time load. Updating a knowledge graph changes only the relevant records and connections. Build the ingestion pipeline for real-time updates from day one, not as a retrofit.
Keep the graph and the LLM in separate layers. The LLM extracts. The graph stores and reasons. Mixing these responsibilities creates architectures where hallucinations propagate into the graph and compound over time.
Build for GraphRAG from the start. The entity types and relationship paths you define at schema design time become the paths GraphRAG will follow at inference time. Designing them with retrieval in mind produces a graph that is useful for AI inference from the first query.
Build the Knowledge Graph Your Enterprise AI Actually Needs
Most enterprise AI projects do not fail in the model layer. They fail in the knowledge layer: unvalidated extractions that corrupt the graph, duplicate entities that degrade query results, retrieval architectures that cannot explain what they return. The five-stage pipeline in this article exists to prevent exactly those failures and the graph database at its center is what determines whether the architecture holds at production scale.
TigerGraph is built for that requirement. Its massively parallel, native graph and vector architecture handles the entity resolution, schema validation, and GraphRAG retrieval that enterprise AI demands at scale, without stitching together separate systems for each stage.
FAQs
What is a knowledge graph LLM?
A knowledge graph LLM is an AI architecture that combines a structured knowledge graph with a large language model. The graph supplies verified entities and relationships; the LLM makes them accessible through natural language queries. The result is an AI system that produces factually grounded responses because it is reasoning from real, validated data rather than statistical patterns alone.
Can LLMs build knowledge graphs automatically?
LLMs can automate the extraction phase (named entity recognition, relationship extraction, and entity disambiguation from unstructured text), but a production-ready knowledge graph also requires schema design, validation, entity resolution, and governance that cannot be fully automated. Human judgment is required at ontology design and post-ingestion validation, particularly in domains where category distinctions have significant downstream consequences.
What is an LLM graph transformer?
An LLM graph transformer converts unstructured text into structured records, each in the form of (entity1, relationship, entity2) ready for ingestion into a graph database. It is the component that bridges raw content and a queryable knowledge graph, and it is where schema-aware prompting and validation make the difference between accurate extraction and a graph full of inconsistent records.
What is the difference between RAG and GraphRAG for knowledge graphs?
RAG retrieves documents based on semantic similarity between the query and stored text chunks. GraphRAG follows relationship paths through a knowledge graph to retrieve structurally connected, factually verified information. GraphRAG produces more accurate and explainable responses because it is grounded in verified entity relationships rather than text similarity patterns, and every result can be traced back to a specific path in the graph.
Graph Keeps Agentic AI Systems Safe with Guardrails, Not Guesswork
In the world of autonomous AI, control is everything. And agentic systems, consisting of AI agents capable of setting goals, making decisions, and taking action, are quickly moving from experimental to enterprise. But as autonomy grows, so does the need for accountability. And that raises a critical question: what shouldn’t an agent do?
When agents act independently, they need more than instructions—they need boundaries. Business rules, ethical norms, risk thresholds, compliance constraints. These are non-negotiable in enterprise environments. But they can’t be bolted on after the fact, and they can’t be static. Agents operating in dynamic systems require guidance that adapts in real time, and that’s where traditional rule engines and hardcoded logic fall short.
Graph Provides a Better Foundation
Unlike rigid policy frameworks or black-box heuristics, graph technology encodes guardrails as contextual, adaptive relationships. It enables AI agents to reason not just about their goals, but about the environment, policies, and people they’re accountable to, before they act.
And with TigerGraph, that reasoning becomes fast, scalable, and transparent. It’s built directly into the agent’s decision logic from the start.
Why Guardrails Matter More Than Ever
Agentic AI has enormous potential, but that potential comes with risk. When AI agents are capable of acting on their own, even small blind spots can lead to outsized consequences. A customer service agent might escalate too quickly, or not at all. A digital assistant in a regulated industry might pull in outdated policies or make recommendations that don’t meet compliance standards. An engineering co-pilot might initiate actions based on an old version of a system spec.
And these missteps don’t stem from malice or malfunction. They happen because the agent didn’t know better, because it wasn’t grounded in the right context.
Large language models (LLMs) are generative, not judgmental. They can produce convincing outputs, but they lack built-in guardrails. They don’t retain long-term memory, track behavioral norms, or infer relationship dynamics across tasks and tools unless that structure is provided to them. In critical enterprise workflows, that’s not good enough.
You want a model that can produce language, but you need one that understands the environment in which it is operating. An agent that knows the difference between typical and risky, standard and exceptional, appropriate and potentially harmful.
Another concern is that GenAI works on statistical probabilities, not clearcut facts. The statistical nature is what enables it to produce fresh-sounding content, but it also means that once in a while, it will hallucinate and produce something that isn’t true.
That’s where graph comes in.
Graph technology models clear knowledge, principles, and their meaning. With a graph, you can encode business rules, behavior boundaries, relational norms, and access controls directly into the system. These become traversable, queryable structures that guide agents in real time.
Instead of relying on post hoc filtering or static prompt instructions, agents backed by graph can check their context before they act, ensuring decisions reflect your goals, policies, and risks at that moment. It’s the foundation for responsible autonomy.
Graph Is the Foundation for Responsible Autonomy
For agentic AI systems to operate responsibly, they need more than a list of rules. They need a living framework that reflects how your organization works.
Traditional systems often rely on brittle rules engines or hard-coded workflows to enforce business logic. But these approaches lack flexibility, adaptability, and context. They don’t evolve as the environment changes, and they don’t scale well across diverse use cases.
Graph offers a fundamentally different approach.
Instead of embedding rules in procedural code, graph technology allows you to model the logic of your system as part of the data itself. Relationships, policies, constraints, permissions, and behavioral norms all become part of the graph structure. They’re referenced, encoded, and enforced through the graph’s topology and traversal logic.
With TigerGraph, these embedded guardrails are:
- Persistent – They’re not tied to a single session or prompt. The logic lives within the graph and is accessible at any time, across agents, users, and tasks.
- Compositional – Guardrails can be linked to both entities and relationships, meaning your AI can reason not just about who someone is, but what they’re allowed to do, with whom, and under what conditions.
- Context-aware – As data updates in real time, so does the logic. If a user’s role changes, or a project’s risk status shifts, the graph reflects that immediately—no manual rewiring required.
This means when an agent queries TigerGraph, it’s not just pulling isolated facts. It’s operating within a connected, rule-informed environment—one that understands who can do what, when, and why.
That is real-time reasoning, powered by a structure that keeps autonomy aligned with accountability, moving the needle from manipulating data to recognizing constraints.
From Data to Constraints
TigerGraph’s platform is built for complex, real-time, multi-hop reasoning. It’s the exact kind of traversal needed to keep autonomous agents safe and aligned. Here’s how it works in practice:
- Behavioral Boundaries: Encode what “normal” looks like for an agent, user, or process. If an action deviates from expected behavior, the graph flags or blocks it.
- Access Control: Link permissions not just to users, but to roles, contexts, timeframes, and relationships. Agents can check, for example, whether a customer is eligible for a refund based on their purchase history, account status, and prior exceptions, without brittle if-then logic.
- Dependency Awareness: Agents can map dependencies between actions before executing them. If a task requires approvals or data from another workflow, the graph can enforce that sequence.
- Explainable Rejection: When an agent refuses to act, it can explain why, because the graph contains not just the data, but the logic and history behind the decision.
This isn’t about replacing LLMs. It’s about complementing them. Graph gives structure to autonomy.
Real-World Example: Agentic AI in Customer Service
Imagine an agentic AI system supporting a telecom provider. The system fields upgrade requests, troubleshoots issues, and offers new promotions.
A customer calls to request a plan downgrade. The LLM knows how to respond, but the graph determines what it’s allowed to offer based on:
- The customer’s tenure, usage, and history of plan changes
- Internal policies about downgrade limits
- The retention team’s intervention rules
The agent doesn’t guess. It checks. The result? A decision that’s fast, fair, and explainable.
From Black Box to Guardrails You Can Trust
Agentic AI isn’t just about autonomy—it’s about alignment. And that means building systems that not only generate actions but understand when not to act. Graph technology enables this by embedding policies, relationships, and constraints directly into the environment in which the agent operates, not as a layer added on top, but as part of the decision-making fabric itself.
TigerGraph makes this real, operational, and enterprise-ready. With real-time graph traversal, built-in algorithmic logic, and distributed performance, TigerGraph empowers agents to reason across context, roles, and history before executing a decision. It results in systems that adapt dynamically, explain themselves clearly, and stay aligned with your organizational values.
In a world where AI will increasingly act on our behalf, graph provides the connective structure that keeps agents grounded. And TigerGraph turns that structure into a scalable, intelligent foundation for responsible autonomy.
Try TigerGraph Savanna free today—the fastest way to build, scale, and run graph-powered AI applications in the cloud. https://tgcloud.io
Why Agentic AI Needs More Than Just Rules (It Needs Guardrails)
Traditional AI models often operate in rigid, rule-based environments, but real-world scenarios demand nuance. Agentic AI doesn’t just follow instructions—it interprets them, reasons through options, and makes choices based on perceived goals. To do that responsibly, it needs more than logic—it needs context.
Graphs provide this context.
Graph databases model not just data points but the relationships between them. A knowledge graph, for instance, can represent everything from company policies and domain-specific regulations to behavioral norms and ethical principles. This allows an agentic AI to reason through decisions in a more human-like, adaptable way.
Self-Driving Cars and Situational Awareness
Consider a self-driving car: Programming the legal rules of the road—speed limits, stop signs, right-of-way laws—is relatively straightforward. These are hard-coded, rule-based instructions. But driving isn’t just about following laws. It’s about reading the room.
Take the rule, “Yield to pedestrians.” It seems simple. But what happens when a pedestrian is near the curb, scrolling on their phone, making no eye contact? What if the crosswalk light is blinking and traffic is backing up? Is the person about to cross—or just waiting for an Uber?
These are not binary decisions—they require situational judgment. And that’s where traditional logic systems fall short. Behind the curtain, an autonomous vehicle needs to:
- Ingest real-time data from sensors (e.g., lidar, cameras, GPS) about nearby objects, speed, trajectory, and intent.
- Link this data to context: Is this a school zone during drop-off hours? Has the same pedestrian crossed here before? Is this behavior consistent with past crossing patterns?
- Weigh competing priorities: safety, legality, traffic flow, rider experience.
This is where graph comes in. A graph-based system connects these data points as a web of relationships:
- The pedestrian is a node, linked to attributes like direction of movement, gaze, phone usage.
- The location is a node tied to school zone status, time-based restrictions, or past accident history.
- The vehicle state (speed, path, braking time) is part of a larger dynamic network that influences and is influenced by all the above.
With this graph, the AI agent can reason through decisions—not just react. It can say, “I’ve seen this pattern before. In similar conditions, the pedestrian crossed late. There’s a history of near misses at this time. The safest move is to yield.”
That’s not just compliance—it’s judgment. And it’s made possible by a graph that models not just what is, but how everything relates.
In short, graphs give agentic AI the situational awareness to act more like a cautious, adaptive driver—not just one following the letter of the law, but one aligned with the spirit of it.
Building Responsible Autonomy with Graphs
As AI systems evolve from reactive models to autonomous agents, their ability to operate independently introduces new risks—and new responsibilities. Agentic AI doesn’t just follow a linear set of instructions; it makes decisions, adjusts strategies, and acts over time in dynamic environments. These systems need more than data and logic to ensure that autonomy is exercised responsibly. They need context, norms, and guardrails.
Graph technology provides this scaffolding by modeling relationships—not just between data points, but between rules, entities, behaviors, and outcomes. It’s the connective tissue that allows agentic systems to reason like humans do—not in isolation, but with situational awareness.
With graph-based infrastructure, autonomous systems can:
Align with Organizational Policies
A graph can represent internal structures such as reporting hierarchies, approval workflows, and business policies. When an AI agent evaluates a course of action—say, escalating a transaction or triggering an alert—it can traverse this graph to understand what’s allowed, who needs to be informed, and under what conditions exceptions apply. This is more than access control—it’s embedded operational intelligence.
Incorporate Domain-Specific Ethics
Legal boundaries, cultural expectations, and industry regulations vary across contexts. A healthcare AI should respect HIPAA privacy constraints. A financial advisor bot might need to avoid investments that conflict with ESG preferences. Graphs make it possible to encode these domain-specific norms as traversable relationships and dynamic rules—so that AI systems can reason through them, not just check boxes.
Adapt While Staying Accountable
One of the promises of Agentic AI is its ability to explore new strategies and learn from outcomes. However, this exploration must happen within well-understood limits in enterprise and regulated environments. Graphs provide those limits—not by halting adaptation, but by guiding it. Graphs are how you encode behavioral norms—not just what’s allowed, but what’s expected.
It’s important to note that not all graph systems can handle the scale, depth, or complexity of real-world autonomous decision-making. Agentic AI requires real-time feedback, deep multi-hop reasoning, and policy-aware traversal logic. This is where TigerGraph’s native parallel architecture makes that vision operational.
TigerGraph, for example, supports:
- Shared-variable logic – for efficient collaborative network exploration and analysis.
- Streaming graph updates – enabling the system to integrate fresh data without disruption.
- Native parallelism – meaning it can handle many decisions and data paths simultaneously.
In plain terms: TigerGraph helps agentic AI systems see relationships as they evolve, adapt decisions as new information comes in, and maintain alignment with human expectations at scale.
This is how you move from automation to alignment. From agents that execute code to agents that act with awareness.
The goal isn’t just to prevent catastrophic failure—it’s to build systems people can trust. Whether that’s a compliance officer reviewing a flagged transaction or a customer relying on AI for a financial decision, explainability and accountability are non-negotiable. And graphs—especially when engineered for real-time performance and complex traversals—are uniquely suited to deliver both.
By embedding policies, relationships, and behavioral expectations directly into the AI’s reasoning substrate, graph technology ensures that as autonomy grows, so too, does accountability. To truly empower AI systems with this level of structured, contextual awareness, you need more than a database—you need a knowledge graph.
What Is a Knowledge Graph—And Why Does Agentic AI Need One?
A knowledge graph is a special type of graph database that doesn’t just store data—it models meaning. It represents entities (like people, accounts, or policies) as nodes and encodes their relationships as edges. But what makes it a “knowledge” graph is how it captures the semantics, rules, and norms behind those connections.
Think of it as a living, contextual map of how your world works—one that:
- Reflects your organization’s policies, data sources, and workflows.
- Describes the context and history of key entities, evolving as situations change.
- Enables AI agents to reason in real-time with awareness of both structure and meaning.
For agentic AI, this is essential. A knowledge graph gives the agent a form of memory, policy guidance, and situational understanding. It can answer questions like: “What actions are typical for this scenario?” “Have we seen a pattern like this before?” and “Does this behavior violate any rules, norms, or expectations?”
When built on a platform like TigerGraph—which is purpose-built for deep reasoning, not just speed—this knowledge graph becomes a live, scalable decision layer.
Its architecture supports the full stack of requirements for explainable, policy-aware AI: from reusable logic (so agents can apply consistent rules across different situations), to streaming updates (so the system can respond to new information in real-time) to parallel traversal (so it can analyze complex relationships across billions of nodes and edges without slowing down).
In short, TigerGraph enables AI systems not only to act fast—but to act with understanding, consistency, and accountability.
Graphs as the Moral Compass of Machines?
As AI becomes more agentic—capable of reasoning, planning, and acting independently—the need for explainability, accountability, and contextual awareness only grows. Graphs offer a way forward. By structuring data around entities and their relationships, graph technology provides the contextual backbone that helps autonomous systems navigate complex environments while staying aligned with their intended goals.
This isn’t theoretical. Forward-looking organizations are already pairing knowledge graphs with real-time data and agentic models to build systems that are not only autonomous—but aligned. In financial services, for instance, AI agents must make decisions that comply with regulations, reflect organizational priorities, and stand up to audit—often in real-time.
TigerGraph distinguishes itself here. Unlike general-purpose graph databases, it is engineered specifically for complexity and enterprise-grade performance. Its ability to support deep reasoning, not just fast lookup, is critical when AI needs to explain why—not just what—it did.
Imagine a digital finance advisor that goes beyond optimizing returns to also consider ethical constraints, long-term goals, and shifting market conditions—all while explaining its choices. Or a healthcare assistant that dynamically adjusts recommendations based on clinical history, social context, and emerging research.
That’s not just decision-making—it’s responsible autonomy. And graphs make it possible.
The future of AI won’t be shaped by model size alone—it will be defined by structure, alignment, and trust. Graph provides the scaffolding, and TigerGraph enables it at enterprise scale.
Let’s build AI that doesn’t just act smart—but thinks responsibly. Reach out to learn more and see the next evolution of graph databases in action!
In today’s data-driven world, artificial intelligence (AI) is transforming industries by providing unprecedented capabilities in automation, prediction, and decision-making. However, as we integrate AI systems more deeply into our lives and businesses, the need for explainability, interpretability, and ethical responsibility becomes critical. This blog post explores how leveraging graph technology can enhance these aspects, creating a more reliable and ethical AI landscape.
Unique Partnership and Innovation
At the heart of this transformation is our unique partnership between TigerGraph and EBCONT. TigerGraph, with its best-of-breed graph database technology, excels in discovering deep insights from complex, connected data. TigerGraph’s platform stands out for its ability to handle massive datasets with exceptional speed and scalability, enabling real-time analytics and advanced machine learning applications. TigerGraph’s technology supports intricate data relationships, providing unparalleled performance for sophisticated analytics tasks.
At EBCONT, a global IT solutions provider, we integrate TigerGraph’s cutting-edge technology with our customers’ business vision and leverage modern data management practices. Our innovation team manages end-to-end solution delivery, encompassing a wide range of expertise, including custom business application development, UX/UI design, data integration, and advanced analytics. Together, with TigerGraph’s unparalleled graph technology and our expertise in creating comprehensive solutions, we are positioned to drive transformative changes across industries.
The Revolutionary Impact of Generative AI
Generative AI, particularly through the use of Large Language Models (LLMs), represents a significant leap forward in AI development. These models are capable of generating human-like text, making them valuable for a wide range of applications from chatbots to content creation. LLMs learn from vast amounts of data, allowing them to perform complex language tasks and provide sophisticated responses.
While generative AI offers immense potential, it also brings challenges, with privacy being a paramount concern. Instead of exposing sensitive data to public websites or external sources, companies must ensure their data remains within their own secure environments. When LLMs are trained on public environments, there is a risk that data could be used to inadvertently learn and memorize confidential information, potentially leading to privacy breaches. Ensuring data privacy and compliance with regulations becomes a complex issue, necessitating advanced solutions to safeguard sensitive information.
The Strengths and Limitations of Vector RAG Systems
Retrieval-Augmented Generation (RAG) systems have emerged as a robust and widely embraced solution for tackling the privacy concerns inherent in LLMs. These systems combine the power of LLMs with vector search capabilities, enhancing their ability to retrieve and generate relevant information quickly and securely. RAG systems can transform ingested images, documents, and audio into embeddings, which are then represented with dense vectors. These vectors can be efficiently compared with user queries through similarity measures, ensuring that private data is not directly exposed or memorized by the model. RAG systems excel in indexing and searching large datasets, making them powerful tools for information retrieval.
However, vector-only RAG systems face significant limitations. They often struggle with bias, lack of context understanding, and the potential for inaccuracies in their responses, commonly referred to as “hallucinations”, issues that were already inherent in LLMs. Bias arises because these models can perpetuate the biases present in their training data, leading to skewed outputs that reflect existing patterns rather than objective and deterministic calculations. Furthermore, vector-only RAG systems have difficulty grasping nuanced meanings beyond textual information alone, lacking the deeper contextual understanding required for more complex reasoning.
These challenges stem from the complexities of natural language processing and the limitations of current algorithms, which may not always represent the full context and underlying relationships accurately. While vector-only RAG systems mitigate privacy concerns, we still require advancements in contextual understanding and bias reduction to fully realize the Generative AI potential.
The Unique Strengths of Graph Technology
Graphs offer a compelling solution to the challenges faced by LLM-based and vector-only RAG systems. Unlike traditional data models, graphs excel at representing and consolidating heterogeneous and interconnected knowledge from diverse business domains.
A key strength of graphs is their ability to represent relationships between nodes – documents, concepts, entities – offering a holistic view of interconnected data points. This relationship structure allows for a more comprehensive understanding of the context and dependencies within the data, which is crucial for contextual reasoning and generating deterministic relevant responses.
Furthermore, leveraging graphs can significantly reduce bias, as they incorporate a broader context and a more nuanced understanding of the relationships between data points. This helps in providing more balanced and unbiased outputs compared to traditional vector-only approaches. Additionally, graphs enhance content relevance by ensuring that the information retrieved and used is contextually accurate and pertinent to the query. They also maintain privacy more effectively by structuring data in a way that minimizes the exposure of sensitive information.
By addressing the limitations of vector-only RAG systems, graphs offer a powerful framework for developing more transparent, interpretable, and responsible AI systems, ultimately leading to better decision-making and strategic planning.
A Graph as the Digital Business Intelligence Hub
A Graph serves as a perpetual hub of a business’s expertise digitized, seamlessly integrating domain-human knowledge with enterprise processes data. By representing these two pillars of organizational intelligence in a structured and interconnected manner, graphs become invaluable assets that can be leveraged across various business processes. This comprehensive digital blueprint of an organization allows businesses to:
- Preserve Expertise: Safeguard the specialized knowledge of experts, ensuring that critical information is not lost due to employee turnover or organizational changes.
- Enhance Decision-Making: Provide decision-makers with a holistic view of interconnected data points, enabling more informed and strategic choices.
- Optimize Processes: Streamline and improve business processes by integrating contextual knowledge into everyday operations, from customer service to product development.
- Support Innovation: Foster innovation by making it easier to identify patterns, correlations, and opportunities within the vast amounts of data that businesses generate.
By leveraging Graphs, businesses can ensure that their accumulated expertise and integrated data assets continue to drive value and innovation. This digital transformation not only enhances the efficiency and effectiveness of business operations but also ensures that the organization’s knowledge remains an enduring and dynamic asset.
Solving Real-World Problems with Graphs
Graphs are already making a tangible impact across various industries. By leveraging the unique strengths of graphs, organizations can address specific challenges with precision and reliability. Here are some key verticals where this technology is transforming operations:
Deepening Personalization
For customer-centric businesses, graphs enhance personalization and customer engagement by providing deeper insights into customer behavior and preferences. Applications in this vertical include:
- Product and Service Recommendations: Analyzing purchase patterns and user behavior to deliver highly personalized product and service recommendations, improving customer satisfaction and sales.
- Customer 360: Building comprehensive, 360-degree profiles of customers by integrating data from various touchpoints, enabling more personalized and effective customer interactions.
- Customer Insights: Gaining deeper insights into customer preferences and behaviors, allowing businesses to tailor their strategies and offerings to meet the unique needs of their customers.
Uncovering Hidden Networks
Graphs can uncover hidden networks and relationships that are crucial for detecting and preventing fraudulent activities. The applications include:
- Fraud Detection: By analyzing complex transaction networks, graphs can identify unusual patterns and suspicious activities, enhancing the accuracy of fraud detection systems.
- Entity Resolution: Graphs can consolidate data from various sources to resolve ambiguities and correctly identify entities, improving data quality and reliability.
- Know Your Customer (KYC): Enhancing KYC processes by integrating diverse data points to build comprehensive profiles of customers, ensuring compliance and reducing risk.
- Anti-Money Laundering (AML): Identifying and analyzing intricate financial networks to detect and prevent money laundering activities, ensuring regulatory compliance and safeguarding financial institutions.
Making Faster Decisions
Graphs enable more agile and informed decision-making by providing a comprehensive view of interdependencies and relationships. Key applications include:
- Supply Chain Management: Enhancing visibility across the supply chain by mapping out complex relationships between suppliers, manufacturers, and distributors, leading to more efficient and responsive supply chain operations.
- Inventory Management: Optimizing inventory levels and reducing waste by understanding the relationships and dependencies between different inventory items and their usage patterns.
- Digital Twins: Creating digital replicas of physical assets with detailed interdependencies, enabling better monitoring, simulation, and optimization of operations.
Augmented Intelligence: Combining Graphs with Generative AI
The integration of Graphs with Generative AI creates a powerful synergy, hereby defined as augmented intelligence. This approach enhances GenAI systems by providing contextualized business reasoning, leading to interpretable, explainable, and ethically responsible AI outcomes. Moreover, it democratizes access to data-driven insights, ensuring that the users can comprehend and leverage them effectively.
Graphs improve contextual understanding by capturing relationships between entities, which allows the AI systems to retrieve contextually relevant information from diverse knowledge sources. This enriched context enhances the relevance and accuracy of AI responses, making the systems more effective in handling complex queries and providing valuable insights and enabling users to ask direct queries and receive complete answers based on the enterprise data landscape. Drawing on verified and specialized knowledge sources, AI delivers more accurate and relevant information crucial for high-stakes decision-making processes where precision and reliability are paramount.
By combining the strengths of graphs with the generative power of LLMs, organizations can develop AI systems that not only perform exceptionally well but also adhere to high standards of transparency and ethical responsibility. This synergy supports better decision-making, strategic planning, and operational efficiency, ultimately leading to more informed and reliable outcomes.
Practical Enterprise-Ready Implementation
Implementing the advanced approach of combining graphs with generative AI involves a well-defined data governance pipeline. This process ensures that data is accurately integrated, contextually enriched, and ethically managed. The key components of this pipeline include:
- Data Integration from Domain Experts:
- Collection: Gather data from various sources, including databases, documents, and expert knowledge.
- Normalization: Standardize data formats to ensure consistency and compatibility.
- Validation: Verify the accuracy and reliability of the data through domain-experts review and automated checks.
- Annotation: Enrich the data with metadata and annotations that capture domain-specific knowledge and nuances.
- Graph Creation:
- Modeling: Design the schema of the Graph to represent entities, relationships, and attributes relevant to the domain.
- Population: Ingest data into the Graph, linking entities and establishing relationships based on the schema.
- Optimization: Optimize the Graph for performance, ensuring efficient querying and retrieval of information.
- Maintenance: Regularly update and refine the Graph to incorporate new data and improve accuracy.
- Vector Search Integration:
- Embedding Generation: Convert text, images, documents, and audio into high-dimensional vector embeddings using machine learning models.
- Indexing: Organize these embeddings in a vector database to enable fast and efficient similarity searches.
- Query Processing: Implement algorithms to compare user queries with the indexed embeddings, retrieving the most relevant information.
- Relevance Tuning: Continuously refine the search algorithms to improve the relevance and accuracy of search results.
- Application of Language Models:
- Model Selection: Choose appropriate LLMs that can interact with the Graph and vector search systems.
- Fine-Tuning: Customize the LLMs to align with the specific requirements and contexts of the enterprise.
- Integration: Seamlessly integrate the LLMs with the Graph and vector search to enable enriched and context-aware responses.
- Monitoring: Continuously monitor the performance of the models, ensuring they deliver accurate and reliable outputs.
- User Experience:
- Interface Design: Develop user-friendly interfaces that allow users to interact with the system easily and intuitively.
- Personalization: Implement features that personalize the user experience based on individual preferences and behavior.
- Feedback Mechanisms: Incorporate feedback loops that allow users to provide input on the system’s performance, which can be used to make ongoing improvements.
- Training and Support: Provide training and support to users to ensure they can effectively utilize the system and understand its capabilities.
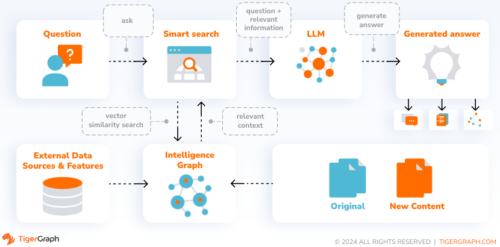
This image illustrates how these elements come together, providing a clear pathway from data ingestion to actionable insights. By structuring data governance in this manner, organizations can effectively manage their knowledge assets, ensuring accuracy, relevance, and ethical responsibility. This holistic approach not only enhances data quality and retrieval but also supports the creation of more transparent, interpretable, and responsible AI systems.
Conclusion
The integration of graph technology with generative AI represents a transformative step in AI development. By addressing critical challenges in privacy, bias, and contextual understanding, this approach enhances the transparency and responsibility of AI systems. As we advance, the continued focus on these principles will ensure that AI remains a force for positive and ethical progress in our data-driven world. The graph will be at the heart of this transformation, providing a stable foundation for leveraging human expertise in every aspect of business operations. This synergy of advanced AI and structured knowledge will pave the way for more reliable, responsible, and innovative solutions in the future.
In March 2024, the Francis Scott Key Bridge across the entrance to Baltimore Harbor collapsed when a cargo ship lost power and crashed into it. Tragically, six bridge workers lost their lives. The economic cost has been significant as well. Sea traffic in and out of the harbor was halted for a month. Baltimore is the United States’ number one port of entry for passenger vehicles, work trucks, plywood and laminated wood, nickel, zinc, aluminum, and many other finished and intermediate materials.[1]
Thirty thousand vehicles that used to cross the bridge each day now take longer, slower routes. That includes 5,000 trucks carrying $28 billion of goods.[2] Rebuilding the bridge may take four years.
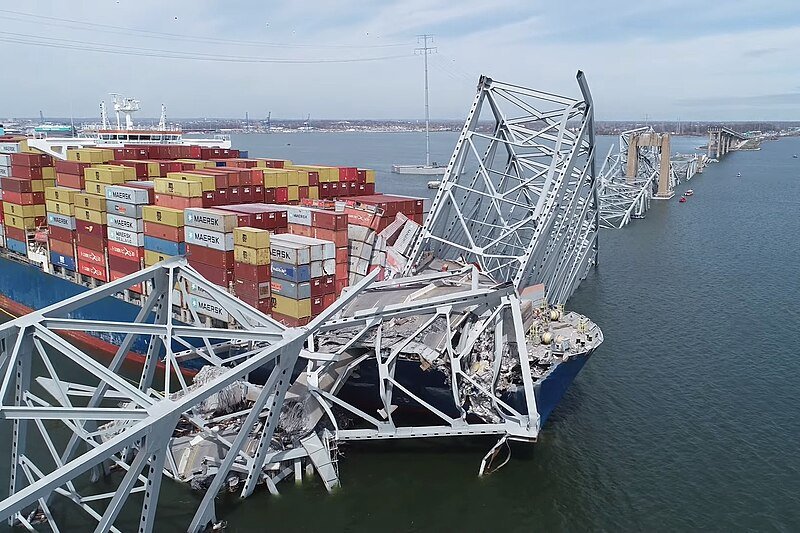
Francis Scott Key Bridge and Cargo Ship Dali, March 2024. Source: ntsb.gov
Was your business impacted by the bridge collapse? How quickly would you know if your supply chain has been disrupted? Many businesses can’t afford to rely on their direct suppliers to make best efforts. These businesses monitor the daily activities of multiple levels of production. In some cases, they acquire at least partial ownership of suppliers, to help to guarantee reliable production.
We can’t predict events like the Baltimore bridge collapse, but businesses can improve their responsiveness and resiliency.
More and more companies are seeing the wisdom of building and maintaining a digital twin of their supply chain – to show them how everything should fit together and to analyze what-if scenarios. From there, businesses can make adjustments to the supply chain to improve performance, lower costs, and increase resiliency.
Graph: The Natural Choice for Supply Chain Modeling
For a supply chain digital twin, a graph database makes a lot of sense. The key entities (components, suppliers, assembly facilities) and their key details (capacity, costs, location, throughput time) can be modeled in almost any database. In a supply chain, however, the connections and dependencies are the whole game, and graphs are designed to treat connections as data.
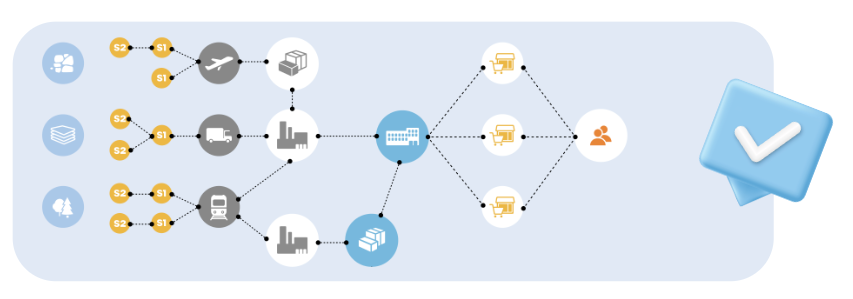
Graphs are a natural model for supply chain modeling.
Traditional data systems have been based on tables of information. A table can answer a simple question like “which suppliers are in Brazil?”, but table-based systems are slow and difficult to use when the task requires tracing several levels of connection to answer more refined questions, such as: what components do the Brazilian suppliers make, which assemblies use those components, which products use those assemblies, who is shipping those products, and who has an important order for those products? For a graph database, on the other hand, tracing downstream from a point is a very simple query, sometimes known as Directed Breadth First Search. If Brazil is modeled as a node, then we could find every affected entity using this GSQL snippet:
Source = {Brazil};
Affected = SELECT t FROM Source:s -(>*)- :t;
Your digital twin can answer questions like:
- • Bill of Materials: List ALL the components needed to produce one unit of a product. Who are all the possible suppliers for each component?
- • Downstream analysis: If plywood arriving in Baltimore is delayed, how will that affect a home builder in Ohio?
- • Upstream (root cause) analysis: a quality control problem has popped for an access panel
An interesting use case is when multiple downstream symptoms occur. We can use the graph-based digital twin to trace upstream for the multiple paths simultaneously, to see where the paths intersect. These intersection points represent possible single causes that resulted in multiple downstream problems, as shown in the following figure:
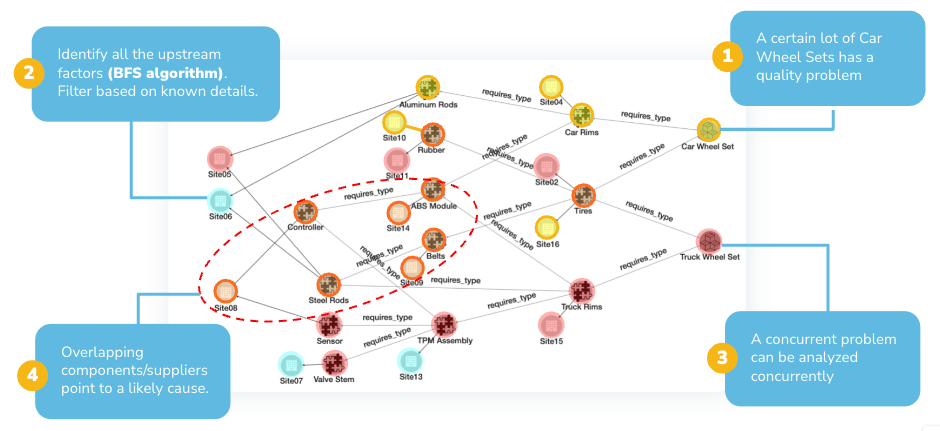
Tracing two quality problems upstream to see if there is a common cause.
The graph-based digital twin gives you the agility to detect problems and respond quickly: trace causes or consequences, uncover alternative paths, and simulate the effect of remediation.
Perform Deeper Analysis
A good digital twin not only understands connections, but it also analyzes them. That is, it can gather data as you traverse the nodes and edges of the graph, perform computations and make assessments in order to calculate scores, find patterns, rank one situation compared to another, and find outliers. Wondering whether using the cheapest supplier for each component actually leads to the cheapest total cost of production? Find the actual cheapest total cost using a weighted shortest path algorithm. Wondering which assembly facility is bringing together the most components for the most different products? The betweenness centrality graph algorithm ranks nodes according to that sense of being “in the middle of things”.
A number of useful analyses can be performed either by generic graph algorithms or predictable analyses used for supply chains, such as “report the bill of materials for product X.” However, every business has unique issues and unique questions. Forward-thinking businesses are looking for platforms that not only handle their needs today, but have the extensibility and flexibility to handle tomorrow’s needs.
Optimize Your Supply Chain for Resiliency
Businesses are seeing that it’s not enough to monitor and react quickly. That’s being reactive. They need to be proactive: anticipate and restructure to reduce the impact of possible disruptions. Businesses need to make their supply chains more resilient, so that they will continue to operate at acceptable levels, despite a range of impacts.
It’s helpful to deconstruct the risk from disruptions into a few components:
- • What is the probability of a disruption?
- • What would be the cost of a disruption?
Estimate Probability of Disruption
Estimating the probability of a disruption can be hard. There are so many factors which are hard to put a number on. It is helpful to break this down into different factors. as weather, government regulations, past performance of the supplier, etc. In some cases, the best you may be able to do is to rank components or suppliers relative to one another. Even without exact numbers, we can logically deduce two axioms:
- 1. Increasing the number of subcomponents required to make a product will increase the likelihood of a disruption.
- 2. Adding alternate suppliers for a component will decrease the likelihood of a disruption.
A digital twin can be programmed to take the estimated probabilities or rankings of base-level factors and then apply the mathematics of probability to compute downstream probabilities. First compute the probability of disruption for the initial stages of production. Then work down level by level until you eventually get to finished goods.
Compute the Cost of a Disruption
If a part is completely unavailable or an essential machine is broken, we trace down the supply chain to see which subsequent operations are halted. Perhaps you have some existing inventory you can use for a while, but at some point, everything downstream will grind to a halt. If the disruption is a price change or a delay, your digital twin can add up those costs too, much the same way that it can compute a bill of materials.
Test and Make Optimizations
Once you’ve scored your supply chain components and suppliers for risk, then it’s time to take action. The analytics will not only point to the most risky aspects, but they will hint at what changed will reduce the risk. Whether the change is to qualify alternate suppliers, to move the location for an operation, or to seek a more modular design with interchangeable parts, the digital twin allows you to simulate the expected result and to monitor actual results.
The Benefits of Graph-Based Digital Twins
Businesses in many different sectors, from automobile manufacturing to personal care products, grocery stores, and biotechnology are exploring and using a graph analytics platform like TigerGraph to model their supply chain or manufacturing processes. The benefits they see include:
- • The ability to model very complex systems in an easy-to-understand and easy -to-update fashion
- • Rapid and flexible reports on upstream and downstream dependencies
- • Analytical tools for optimizing and improving the resiliency of their processes
- • The ability to easily develop new analytics
- At TigerGraph’s recent Graph AI Summit, a workshop focused on a graph-based digital twin solution for supply chains.
TigerGraph will soon be releasing Solution Kits targeting supply chain and other operational network use cases. To learn more, visit tigergraph.com or drop us a line at info@tigergraph.abstage.xyz.