Summary
- Collaborative filtering recommendation system algorithms predict preferences from past interactions, but hit hard limits with cold starts, data sparsity, and no awareness of relationship context.
- Graph database recommendation system algorithms store users, items, and their relationships together, enabling multi-hop traversal, real-time personalization, and explainable recommendations.
- The core difference is the data model: a flat interaction matrix versus a rich, traversable relationship network that reflects how people and products actually connect.
- Graph recommendations outperform collaborative filtering when explainability, real-time context, cold-start coverage, or complex relationship signals are required – financial services, healthcare, B2B, and streaming are high-fit use cases.
- Most enterprise systems use both approaches: collaborative filtering for dense interaction baselines, graph for real-time, context-rich, and explainable personalization at scale.
When recommendation systems first made an impact, nearly all operated on collaborative filtering recommendation system algorithms. The results were significant: personalized recommendations drove up to 5x growth in sales for e-commerce, streaming, and social media companies. But as customer data has grown richer and relationships more complex, collaborative filtering has started to show its structural limits. It only understands what users have done, not who they are, how they connect to others, or what context they are in right now.
A fundamentally different class of recommendation system algorithms, built on graph databases, is powering the next generation of personalization. These systems understand the full relationship network around every user and product, respond to real-time behavior, and produce recommendations that are transparent and explainable.
In this article, you’ll learn:
- How collaborative filtering recommendation system algorithms work and where they break down
- How graph database recommendation system algorithms represent and query richer relationship data
- Where the two approaches differ and which enterprise use cases favor each
- How a Customer 360 graph architecture raises the quality of every recommendation
How Collaborative Filtering Works – And Where It Breaks Down
What Is Collaborative Filtering?
Collaborative filtering is the technique behind most traditional recommendation system algorithms. It predicts what a user will prefer by analyzing patterns in past interactions across all users – if two users liked similar items, what one liked next is recommended to the other. Two main variants exist: user-based filtering, which finds similar users and recommends what they liked; and item-based filtering, which finds items similar to ones the user has already shown interest in.
Collaborative filtering has a long, well-documented history in recommendation system algorithms. Over that time, four structural limitations have emerged consistently.
- Cold start problem. New users or new items have no interaction history, making reliable recommendations impossible at the start of a relationship.
- Data sparsity. Most users interact with only a small fraction of available items, leaving large gaps in the similarity matrix that make calculating meaningful similarity difficult.
- No relationship context. Collaborative filtering records that users are similar, but not how they are connected, what attributes items carry, or what external context the user is in – location, time, device, or current session behavior.
- Static recommendations. Similarity scores are computed offline from data snapshots, often days old. They do not update as a user’s session evolves.
Each limitation is manageable in isolation. Together, they point to an underlying data model problem. Collaborative filtering is built on a sparse, flat interaction matrix. It cannot represent the richness of real relationships between users and items.
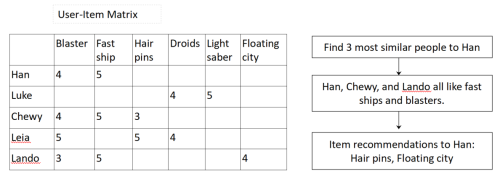
Consider a simple example. Chewy and Lando are the users most similar to Han in expressed preferences, so the recommendation for Han surfaces items both liked that Han has not yet seen. The system surfaces hair pins and a floating city – but it cannot tell Han about an item that Lando’s friend Wedge loves, because Wedge’s purchasing behavior sits two relationship steps away from Han’s interaction matrix. Those indirect connections are invisible to collaborative filtering recommendation system algorithms.
Content-based filtering is sometimes layered in to patch some of these cracks, but it does not resolve the underlying data model constraint: every user and item interaction is still analyzed in isolation. That cumulative fragility has driven a significant shift in newer recommendation system algorithms toward graph databases as the foundational data model.
How Graph Databases Power Recommendation System Algorithms
What Is a Graph Database?
A graph database is a database designed to store and query data as a network of entities and the relationships connecting them. Rather than organizing data in tables or vectors, a graph database treats relationships as first-class data – stored, indexed, and traversable at query time. This makes graph databases the natural fit for recommendation system algorithms that need to follow chains of connections across users, items, behaviors, and context. Examples of graph databases include TigerGraph, Neo4j, and Amazon Neptune.
Using a graph database for recommendation system algorithms enriches the context and structure of the data in ways a flat interaction matrix cannot. Graph databases store not just data points, but equally the relationships between them – and those relationships carry meaning.
In a graph recommendation system, users, items, categories, attributes, and events are modeled as entities. Interactions, preferences, similarities, and hierarchies are modeled as relationships. Moving from a matrix to a traversable graph provides a representation that mirrors the complexity of reality more closely than any flat data structure.
The graph stores not just that Leia likes Luke, but that they love each other, are family, and are siblings. Not just that someone bought a game, but that they disliked it and which game they preferred. Not just that someone visited a new store, but that they stayed for nearly an hour. Every signal becomes part of a queryable relationship network.
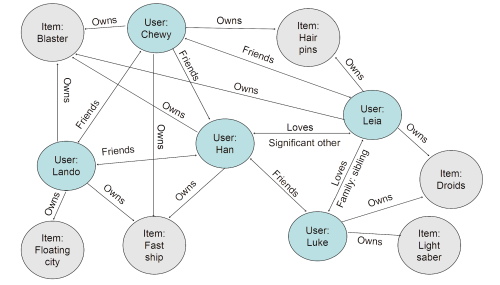
Relationship weights quantify the strength and importance of connections, giving the algorithm far more signal than simple user similarity scores. In the example above, Han is friends with Luke and in love with Leia – Luke and Leia are siblings. As both own droids, the graph recommendation for Han surfaces droids. More importantly: Lando’s friend Wedge loves X-wing fighters and automatic targeting systems. Because Han and Wedge are connected through two relationship steps, those items surface in a graph recommendation that collaborative filtering would never produce.
Here’s another real life example: running shoes may be an excellent recommendation for a user who has never purchased athletic gear, but follows running athletes on social media and is connected to several people who bought running shoes in the past week – especially if those friends are themselves connected to five others who just bought the same product. The graph sees that signal. The flat interaction matrix does not.
There are three main types of graph database recommendation system algorithms:
- Graph traversal-based recommendations. Following relationships from the target user to items that connected users have interacted with, but the target user has not. Traversing deeper beyond a single relationship step surfaces more novel, indirect recommendations.
- Graph Neural Network algorithms using graph embeddings. Graph Neural Networks (GNNs) learn vector representations for each entity that encode both its attributes and its structural position in the graph. These embeddings power similarity-based recommendation system algorithms that incorporate relationship context, not just item features. GNNs significantly outperform traditional machine learning on this class of problem.
- Hybrid graph and vector search. Combining graph relationship following (including relationship filters, user context, and access constraints) with vector similarity search (for content or behavior similarity) gives a powerful boost to both recommendation novelty and accuracy.
The ideal platform for these recommendation system algorithms supports all three: graph analysis, GNN support, and hybrid graph and vector search in the same query engine.
Graph vs. Collaborative Filtering: Comparing Recommendation System Algorithms
Graph database recommendation system algorithms and collaborative filtering are not mutually exclusive. Many production systems use both. They handle different data conditions and offer different capabilities. The table below highlights where graph database recommendation system algorithms provide a measurable advantage.
| Graph | Collaborative Filtering | |
| Core data model | Entities (users, items, categories, attributes, events) connected by typed, weighted relationships. | Interaction matrix: user-item interactions only. |
| Handles cold start | Uses relationship connections and item attributes to recommend even without prior interactions. | Struggles with limited or no interaction history for new users or items. |
| Real-time personalization | Queries real-time, updated relationship data for every recommendation. | Computes offline from data snapshots, often days old. |
| Relationship and context signals | Rich context: quantified relationships, multi-hop indirect connections, behavioral and attribute signals. | Isolated user-item interactions. User similarity calculated from past item interactions only. |
| Explainability | Relationship paths in the graph explain recommendations directly. | Algorithmic calculations are difficult to trace or audit. |
| Scalability for complex queries | Fast response at enterprise scale. | Struggles above one million users for complex similarity calculations. |
| Best-fit use cases | Real-time personalization, cold-start coverage, explainability requirements, and complex relationship signals. | Baseline recommendations with dense interaction data and limited user metadata – music and video streaming, for example. |
Two differences carry the most commercial weight.
Explainability. Graph relationships are essentially self-explaining recommendation paths. Han loves Leia. Luke is her brother. Both own droids. Han might want a droid. Showing users why a recommendation was made increases trust and measurably improves response rates. Collaborative filtering produces a similarity score – difficult to audit and nearly impossible to present to an end user.
Real-time personalization. Recommending in real time requires fast queries across multiple related data points at any dataset size. New signals from a user’s current session are captured in the graph immediately, and included in the next recommendation calculation without waiting for a batch recompute. For enterprises where purchase intent changes by the minute, that responsiveness is a direct revenue driver.
Enterprise Use Cases: Where Graph Recommendation System Algorithms Outperform
Certain recommendation system use cases are particularly well-matched to graph database solutions. In each, the relationship richness of the graph provides an advantage that a flat interaction matrix cannot replicate.
- E-commerce and retail personalization. A graph data model connects browsing history, purchase history, social signals, product attributes, and real-time session behavior into a single queryable model. Recommendations respond to mid-session behavior changes without a full model retrain – a direct advantage over batch-computed collaborative filtering recommendation system algorithms.
- Streaming and content platforms. Graph databases model the full content catalog as a network of genres, creators, themes, and user communities. This allows graph recommendation system algorithms to surface relevant content a user has never interacted with, solving both the cold-start and long-tail content discovery problems at the same time.
- Financial services. Products, accounts, life events, and peer behavior all become part of the graph, making recommendations for the right financial product at the right moment in the customer journey highly explainable. Regulatory transparency requirements are met through traceable relationship paths – an audit trail that collaborative filtering recommendation system algorithms cannot provide.
- Healthcare and life sciences. Using a knowledge graph for recommender systems connects patient attributes, treatment pathways, research findings, and clinical outcomes. Making relationship context a primary feature of the data model surfaces more relevant care options or drug candidates.
- B2B and enterprise platforms. Company hierarchies, buying relationships, product dependencies, and account history all map naturally to a graph model. Representing these structures accurately powers more relevant next-best-action and cross-sell recommendation system algorithms in complex, multi-stakeholder sales environments.
Customer 360: The Foundation That Makes Graph Recommendation System Algorithms Work
A graph recommendation system is only as good as the graph data behind it. A well-built Customer 360 project feeds all available information from across the enterprise into the graph, providing the richest, most complete picture of each customer that is possible.
What Is Customer 360?
Customer 360 is a strategy for deeply understanding a customer’s needs, wants, and position in their journey by aggregating every piece of information an enterprise holds about them: purchases, browsing data, support interactions, social connections, account attributes, and real-time actions. In a graph database, information scattered across enterprise systems becomes a single, traversable relationship network.
A recommendation system is only as good as its picture of the customer. That picture depends on two things working together: a unified view of who the customer is, and a continuously updated view of what they are doing.
That is where customer 360 and entity resolution reinforce each other. Entity resolution consolidates multiple data versions of the same customer across systems, eliminating misleading duplicates and combining a customer’s full history into a single model. Without it, the same person appears as several fragmented records, and recommendations are built on an incomplete, sometimes contradictory picture. Once those records are resolved into a single entity, a graph database customer 360 makes everything an enterprise knows about that customer queryable in one place. Add real-time updates that capture what customers are doing in their current session, and recommendation accuracy increases significantly because the algorithm is finally working from a complete, live picture rather than a static, fragmented one.
Closing Remarks on Graph-Powered Recommendation System Algorithms
Collaborative filtering remains useful for simple, baseline recommendations with dense item interaction data and limited data about the user. But the best way to boost the response rate of any recommendation system is a Customer 360 project that provides a richer picture of both the customer and where they fit in their web of relationships and interactions. Graph is the only data model that represents both the entities and the relationships that give them meaning. For the real-time personalization, cold start coverage, explainability, and full customer context that enterprises need most, graph database recommendation systems are ideal.
Explore the TigerGraph recommendation engine or check out pricing and the free trial to see how graph works at your scale.
FAQs: Graph Database Recommendation System Algorithms
What is the difference between collaborative filtering and graph-based recommendation system algorithms?
Collaborative filtering uses a flat interaction matrix that records only user-item interactions. Graph recommendation system algorithms use a relationship network that includes user connections, item attributes, contextual signals, and real-time behavior – producing richer, more explainable recommendations, particularly in cold-start conditions and for users with complex relationship contexts.
What are the main recommendation system algorithms used in graph databases?
There are three primary types: graph traversal-based recommendations that follow relationship paths from a target user to indirectly connected items; Graph Neural Network algorithms that use graph embeddings to encode both entity attributes and structural position; and hybrid graph and vector search that combines relationship following with semantic similarity for improved novelty and accuracy.
Does a graph database solve the cold-start problem in recommendation systems?
Yes. Even when a user has no interaction history, graph recommendation system algorithms can recommend based on demographic similarity, network connections, and item attribute relationships. The graph finds signal in who the user is connected to and what attributes they share – not just what they have previously purchased.
What is the best graph database for recommendation system algorithms?
TigerGraph is designed for enterprise-scale recommendation workloads, with massively parallel processing architecture, real-time multi-hop relationship analysis, and native hybrid graph and vector search capabilities in a single query engine. It is built for the production-scale performance and explainability requirements that mission-critical recommendation system algorithms demand.
How does Customer 360 improve recommendation accuracy?
A complete, connected view of the customer provides richer contextual signals for recommendation system algorithms – purchase history, browsing behavior, support interactions, social connections, and real-time session activity all in one traversable model. This eliminates the reliance on interaction history alone, giving graph recommendation system algorithms the full context they need to surface relevant, timely, and explainable recommendations.
In the rapidly evolving landscape of data analytics and artificial intelligence (AI), the recent talk by Dan McCreary, Head of AI at TigerGraph, at the NVIDIA GTC event stands out as a significant milestone. His presentation, titled “Enhanced Data Analytics: Integrating NVIDIA Rapids cuGraph with TigerGraph,” shed light on the critical importance of graph databases in AI and the groundbreaking work TigerGraph is doing in collaboration with NVIDIA. This blog dives into the key insights from Dan’s talk and the implications for the future of AI and data analytics.
The Critical Role of Graph Databases in AI
Dan McCreary kicked off his presentation by emphasizing the crucial role of graph databases in the realm of AI. Graph databases, unlike their relational and non-relational counterparts, are designed to handle highly interconnected data efficiently. This characteristic makes them particularly suited for applications that require the analysis of complex relationships between data points, such as fraud detection in banking—a field where TigerGraph has already marked its prowess with several successful implementations.
Drawing inspiration from Jeff Hawkins’ theories on the brain, as outlined in his books, Dan used a poignant quote to set the stage: “The key to artificial intelligence has always been the representation.” This statement highlights a fundamental challenge in AI: accurately modeling and representing the data in a way that machines can effectively process and learn from.
Navigating the Representation Problem in AI
Dan’s talk delved into the representation problem in AI, a crucial hurdle to achieving more advanced and efficient AI systems. He identified four key types of data representations used in AI today: images, sequences, tables, and graphs. Each of these representations has its domain of applicability and associated challenges, but Dan’s focus was on graph representations due to their ability to model complex relationships and dynamics.
One of the main challenges with graph data is its inherent sparsity and the difficulty of optimizing these representations for hardware. This is where the collaboration between TigerGraph and NVIDIA becomes pivotal. Dan walked the audience through the complexities of dense and sparse matrix representations and discussed the journey towards achieving a fully hardware-optimized graph system.
Leveraging NVIDIA’s RAPIDS cuGraph for Breakthroughs in Performance
The partnership between TigerGraph and NVIDIA has been instrumental in addressing the challenges of graph data analytics. Dan highlighted how TigerGraph is leveraging NVIDIA’s RAPIDS cuGraph libraries to tackle the problems associated with sparse matrix representations. The discussion touched upon the pros and cons of using Python for these tasks but underscored the substantial performance improvements enabled by NVIDIA’s RAPIDS libraries.
A highlight of Dan’s presentation was the demonstration of up to 100x speedups in performance when utilizing NVIDIA GPUs for algorithms like PageRank. This impressive achievement underscores the potential of graph analytics when combined with powerful hardware acceleration, offering a glimpse into the future of AI where graph representations play a central role.
The Synergy Between TigerGraph and NVIDIA: Pioneering the Future of AI Hardware
In closing, Dan McCreary expressed his gratitude towards NVIDIA for their partnership. This collaboration is not just about achieving short-term gains in performance but about jointly paving the way for the next generation of graph-optimized hardware. By combining TigerGraph’s expertise in graph database technology with NVIDIA’s leadership in GPU technology, the two companies are at the forefront of creating solutions that can handle the complexity and scale of tomorrow’s AI challenges.
The significance of Dan McCreary’s talk at NVIDIA GTC extends beyond the technical details of integrating cuGraph with TigerGraph. It represents a pivotal moment in the evolution of AI and data analytics, highlighting the shift towards graph representations as a key enabler of more sophisticated and effective AI systems. As companies increasingly migrate to graph representations to enhance their predictive capabilities, the work being done by TigerGraph and NVIDIA will undoubtedly play a crucial role in shaping the future of AI.
In an era where the ability to analyze and leverage complex relationships in data can provide a competitive edge, the advancements discussed in Dan’s presentation offer exciting possibilities. Whether in detecting banking fraud more accurately or in understanding customer behaviors and product dynamics, the integration of NVIDIA Rapids cuGraph with TigerGraph is setting new benchmarks for what is possible in AI and data analytics.
The journey towards a future where AI can more closely mimic the intricacies of human intelligence and decision-making is fraught with challenges. Yet, with visionaries like Dan McCreary leading the charge and fostering collaborations between industry giants like TigerGraph and NVIDIA, the path forward seems not only clearer but also significantly more promising. As we look ahead, the continued innovation in graph database technology and hardware optimization heralds a new era for AI—one that is more intelligent, efficient, and capable of understanding the complex web of relationships that define our world.
As the Head of Marketing at TigerGraph, I’m thrilled to extend a warm invitation to all enthusiasts, professionals, and curious minds to join us at the upcoming Graph + AI Summit 2024. This event is an absolute must for anyone interested in leveraging the transformative potential of graph technology and artificial intelligence. Here is why:
1. Exclusive Announcements and Sneak Peeks: As a participant of Graph + AI, you’ll be among the first to hear about our latest product announcements, updates, and future roadmap plans. Get exclusive access to sneak peeks, beta releases, and insider information straight from the source.
2. Great Networking Opportunities: At Graph + AI Summit, you’ll have the chance to connect with the industry leaders, innovators, and experts in the fields of graph databases and artificial intelligence. Rub virtual shoulders with professionals from organizations like Mastercard, KPMG, and JPMorgan Chase & Co, among others. Whether you’re a seasoned professional or just starting your journey, networking with like-minded individuals can open doors to collaborations, partnerships, and invaluable insights.
3. Cutting-Edge Insights and Case Studies: Our event will feature keynote speeches, panel discussions, and workshops led by top thought leaders and practitioners. Gain firsthand knowledge from real-world case studies showcasing how leading organizations are leveraging the synergy between graph databases and AI to drive innovation, solve complex problems, and unlock new opportunities.
4. Exclusive Insights from Industry Visionaries: We are honored to have Hamid Azzawe, TigerGraph’s CEO, to present at the event. With a wealth of experience from Meta, Amazon, Microsoft, Bloomberg, RBC, AMFAM, and IBM, Hamid brings a unique perspective to the table.
5. Hands-On Workshops and Demos: Explore the practical applications of graph technology and AI through interactive workshops and live demonstrations. Whether you’re interested in building recommendation systems, fraud detection algorithms, or knowledge graphs, our workshops will provide you with the tools, techniques, and best practices you need to succeed.
Graph + AI Summit isn’t just another event—it’s a gathering of passionate individuals united by a common goal: to unlock the full potential of graph technology and artificial intelligence. Join us on this exciting journey of discovery, collaboration, and innovation. We can’t wait to see you there!
Save the Date: May 1-2, 2024
Location: virtual
Many executives are pondering difficult decisions about making large investments in AI. For many of them, their lack of a technical background makes it difficult for them to visualize the impact of AI on their customers, their products, and their employees. To help executives make the right strategic decisions, we need powerful storytelling in terms they can understand and remember.
I have been creating a set of stories and metaphors to guide executives when they need to make strategic decisions about AI investment. After testing, my Jellyfish and Flatworm story has been remarkably effective at helping them guide their peers. I would appreciate feedback from my readers if this story is sticky enough to guide your leaders.
At the core, this story is about why Knowledge Representation (KR) must be the core of any cost-effective long-term AI strategy. We will see how Large-Language Models (LLMs), Knowledge Graphs (KGs), and Reference Frames (RFs) are moving us closer to general AI and how building hybrids of these three knowledge representation strategies is the best path.
At the end of this story, you can start to ask if your organization is more like a jellyfish or a flatworm. Clues about how much you need to invest in AI will be clear. Let’s begin our story.
The Evolution of Animal Intelligence
About 600 million years ago, animals evolved cells that helped them react to environmental changes. Let’s start with the elegant jellyfish. Jellyfish live in the open ocean, far away from complex structures. A jellyfish only needs simple rules to navigate its environment. Jellyfish might move to depths that allow them to capture more prey and avoid their predators. But they are not hunters. They depend on fish drifting into their tentacles.
Jellyfish live in a relatively simple environment and need to be efficient with their energy use. They really don’t need a complex centralized nervous system to help them navigate the ocean. If jellyfish had a big complex brain that required energy, they would quickly starve. To survive, they needed to keep things simple.
In contrast, on the ocean floor, things were getting much more complicated. To seek their prey and avoid predators, animals like flatworms started to develop muscles to help them move around. They also developed more cells on their skin that could process complex signals such as light, temperature, and smell. They used these sensory systems to get detailed information about their environment. And like the jellyfish, they also developed rules to survive. But not all the rules stayed simple. Knowing both what rules to follow and when to follow them became more complex.
Flatworms are thought to be the first hunters.
Movement and the Evolution of the Central Nervous System in Flatworms

Then something really interesting started to happen. Flatworms started to centralize where these rules were executed. Putting them all near their front-facing sensors made sense. We now call that the “head” of our animals. They started to evolve a complex network of centralized nerve cells, which we now call a centralized nervous system or CNS in their heads. These networks of communicating nerve cells evolved to become the brains of animals that move about in the world.
So why did they need to build such complex and energy-consuming cells? The key thing to understand is that movement makes executing rules complicated. Like an anemone, a plant sits in a single location on the ocean floor. It does not need to understand how things change if it moves. But any animal that moves needs to start to learn the structure of its environment. If it turns around 180 degrees, it needs to know that this helps it move away from predators. The bottom line is that we can’t really understand animal intelligence without having a deep appreciation for understanding how intelligence and models of our world are tied to motion and, importantly, maps and structure.
The Evolution World Models in Brains

Let’s explore why storing models of the world around it gave these flatworms a competitive advantage over their siblings. We ask, how can we have more precise ways to know what rules to execute and when to execute these rules in order to survive?
Imagine two flatworms. One that had a precise model of the world around them in their brain, and another that did not have a precise model. As these animals crawled out of their holes to seek their prey, those with a more precise model would remember where the best food was. They could also remember where predators threatened them. You can think of these models as internal maps of a flatworm’s surroundings. They used these models to give themselves a competitive advantage. They had more offspring, and these offspring also built more precise models of the world around them. We call these models “world models” because their structure represents the world around them.
The key point here is that these early nervous systems evolved into many other much more complex systems that have become our brains. Humans out-competed our extinct ancestors because we could model the world and predict how our actions could help us survive and out-compete our rivals. Modeling what is in our prey or predator’s brain can also be very helpful for survival. Does that mammoth think strategically about the consequences of being headed toward a cliff?
In summary, animals have brains that are predictive organs that must model their world and build mental maps of their world. These models advise us on what actions to take to help us survive. They also give us advice on the consequences of we don’t think strategically about the complex systems around us.
Let’s apply what we learned about jellyfish and flatworms to our organization.
Language Models Are *Not* World Models
Now, you might ask, “What does this all have to do with AI?” Much discussion has been about LLMs and how they are used to generate text. But these language models are fundamentally different from the world models in our brains. Let’s consider how they are different.
LLMs are used to predict the next word given a sequence of preceding words. They were never designed to store accurate models of the real world. Language is a collection of symbols we use to describe our world. When we need to communicate ideas between people, we generate sequences of words that fit within patterns called grammar and syntax. Although tools like ChatGPT and Llama 2 are incredibly useful, they were never designed to model the world and simulate the impact that our actions would have on the future states of our worlds.
Don’t get me wrong here. I love my GPT-4! But we must be clear. Modeling language is only a shadow of how we communicate about the world. It really is not a precise model of the world. It can be complemented with actual models of the world, but fundamentally, the knowledge representation distributed through billions of weights in a neural network has severe limitations with precision, reproducibility, truthfulness, performance, and explainability.
Knowledge Graphs *ARE* World Models
Many of my readers know that I have been deeply involved in building large-scale Enterprise Knowledge Graphs (EKGs) for the last six years. Before that, I wrote books on the tradeoffs of using various NoSQL databases. I am a person who can quickly visualize how knowledge is represented in computers, and my goal is to explain the tradeoffs of these alternative representations.
Knowledge graphs are the closest thing we have today to modeling our world in computers. Oh, and by the way, if you pick the right graph database, you can get it to scale out over hundreds of servers. Google, Amazon, LinkedIn (Microsoft), and even Pinterest have proven this for over ten years.
Just like the flatworm needed to model the structure of their environment by building precise maps, knowledge graphs are also the best way for us to manage structure. This can be the structure of our customers, our products, and our competition.
Animal Brains Use Reference Frames
Now, we come to the most interesting fact. Our brains don’t really store data like large-language models or knowledge graphs. We store knowledge in a form that evolved from building maps of our world. These are called Reference Frames and are described clearly in Jeff Hawkin’s book A Thousand Brains. Unlike an LLM, their knowledge can be continually updated. And just like scale-out distributed knowledge graphs, their processing is done in parallel. I won’t go into too much detail on reference frames here but look to innovative companies like Numenta to combine reference frames with LLMs to build new AI systems.
The take-home point is that reference frames can teach us many things about intelligence and how we need to use maps and structure to help us make better predictions. There will be more to come on this topic in future blog posts.
Measuring Complexity In Your Organization

So, should you be building a model of the world in your internal computer systems? Let’s take a look at what a simple company might be.
Imagine you supply a single specialized part to another manufacturer. You are good at what you do and get the same contract every year. You don’t really have any competition. I would describe this company as living in a simple environment, much like the jellyfish living in the open ocean. We can call this company a “jellyfish company.” You can probably model your organization using a spreadsheet or a relational database that uses flat file representation of the world with a few very slow JOIN operations if things get complicated. Your IT department doesn’t need a huge budget.
Now, let’s look at a more complex company. One that has many customers sells many products, and these products each have many competitors. Their structure might look like the following:
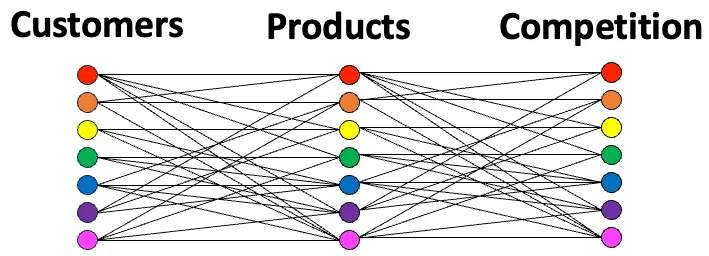
You can see that you need a complex model of your world to sell your products in a highly competitive landscape to many types of consumers. You are more like a flatworm company than a jellyfish company. You need complex models that include structure, relationships, precision, explainability, and the ability to add new complexity at will.
How you manufacture and market your products can be dauntingly complex. Can you simulate the impact of a price increase on one of your products? Are you modeling customer behavior? Can you predict the impact of a new marketing campaign? Can you explain why sales of some items are dropping off? If you can’t do this today, it might be that your model of the real world is too simple and too flat without structure. You might need to invest in using a combination of knowledge graphs and LLMs to accelerate your ability to predict the future.
Conclusion
Today, we are seeing unprecedented investments in artificial intelligence. The first wave is mostly investment in tools to make it easier for firms to build intelligent agents that help worker productivity. But all the agent software in the world might not help if your data is trapped in spreadsheets and siloed data. Knowledge needs to be centralized and connected.
Today, jellyfish companies are exceedingly rare. Most companies must deal with rapidly evolving complexity and make precise predictions that require accurate models of the world around them. Companies must focus on building the foundations that will power thousands of intelligent agents working together on centralized knowledge. And remember, going to the cloud will not save you if you have 1,000 silos.
Let me know if this story works for you. Can you tell this story to executives and ask them “are we a jellyfish or a flatworm company”? Ask them if a centralized knowledge graph would help them answer hard questions about their customer, products and competitors.
If you would like to hear how TigerGraph can help your organization build a centralized nervous system, contact us at info@tigergraph.abstage.xyz. re