What Airline Routes Teach Us About Graph Analytics at Scale
Airline networks offer one of the clearest real-world examples of how connectivity shapes performance and resilience.
When you look at a global flight map, you are not just seeing cities connected by lines. You are seeing a structure. Some airports handle a small number of routes. Others serve as major hubs, connecting dozens or even hundreds of destinations.
In graph terms, airports are called nodes. A node simply represents a point in the system. In this case, it is an airport. The routes between airports are called edges. An edge represents a connection between two nodes. The arrangement of those nodes and edges is known as the network’s topology. Topology describes the overall shape of the network and how its parts are connected.
That structure determines how the system behaves.
If a small regional airport shuts down, the impact may be limited. If a major hub like Atlanta or Heathrow experiences delays, the effects ripple across multiple routes and regions. Delays cascade along connected paths because flights, crews, and passengers are all interdependent.
The disruption does not spread randomly. It follows the network’s structure. Enterprise systems operate the same way.
Key Takeaways
- Network topology determines resilience and influence.
- Centrality measures structural importance, not just volume.
- Shortest-path analysis reveals reachability and exposure.
- Community detection surfaces hidden clusters.
- Graph analytics demonstrates its value under real-world scale and complexity.
Organizations often think of data as a collection of records. But at scale, performance, risk, and influence are determined by how entities connect. A failure in a central system can affect multiple applications. A compromised identity can open pathways across environments. A supply chain disruption can impact downstream partners.
The airline network makes this structural reality visible, and graph analytics makes it measurable. Several graph metrics help quantify how structure influences system behavior. One of the most important is centrality.
Centrality is Not the Same as Traffic
Some airports process massive passenger volumes. Others may handle fewer passengers but serve as essential bridges between otherwise disconnected regions. Structural importance is not identical to raw throughput.
Graph centrality algorithms quantify that distinction. Measures such as betweenness centrality identify nodes that sit on critical paths between clusters. When such a node fails, disruption cascades across the network.
In enterprise environments, the equivalent may be a clearing institution in financial services, a core API gateway in a digital platform, or a supplier in a manufacturing chain. These nodes may not generate the highest transaction counts, but they hold structural leverage.
Volume measures activity. Centrality measures influence. Understanding the difference changes how risk is evaluated. Influence is only one dimension of structural analysis. Graph algorithms also reveal how risk, information, or disruption travels through a network.
Shortest Path is About Exposure, Not Distance
In airline systems, the shortest path between two cities is determined by connectivity, not geography. A city may be geographically close but require multiple hops due to limited routes. Another may be farther away but reachable in a single direct flight.
In graph analysis, moving across these connected routes is called multi-hop traversal. A traversal simply means following edges from one node to another. Multi-hop traversal follows several connections in sequence to understand how two entities are linked across the network.
Graph algorithms compute these paths instantly.
In enterprise systems, shortest-path analysis reveals how quickly risk propagates. A compromised vendor may connect indirectly to a sensitive system through several intermediaries. A supply chain disruption may ripple across tiers in non-obvious ways.
Shortest path analysis transforms abstract exposure into measurable structural reach. It answers the question: how many steps separate risk from impact?
Connectivity patterns also reveal how entities naturally group together within a network.
Community Detection Reveals Natural Clusters
Airline networks naturally form regional clusters. Dense connections exist within geographic regions, while cross-regional routes connect clusters to each other. Graph community detection algorithms identify these groupings based purely on connectivity density.
The same principle applies to fraud rings, customer segments, vendor ecosystems, and infrastructure zones. Clusters emerge from structure rather than predefined categories.
When clusters are identified algorithmically, organizations gain visibility into how activity concentrates. Fraud clusters reveal coordinated schemes. Customer clusters reveal shared behavior. Infrastructure clusters reveal segmentation weaknesses.
Structure defines grouping. Once clusters and pathways are visible, the next question becomes how resilient the overall structure is to disruption.
Resilience is a Function of Topology
When a major hub closes due to weather or operational failure, delays cascade. Flights are rerouted. Some destinations become unreachable. The impact depends on the network’s topology.
Graph modeling allows the simulation of node or edge removal. Organizations can model the impact of removing a supplier, shutting down a data center, or isolating a financial intermediary.
Resilience is not a reporting metric. It is a structural property. Understanding topology transforms contingency planning from speculation into simulation.
Understanding structure is valuable. Maintaining that visibility at real-world scale is what determines whether graph analytics becomes operational.
Scale is the True Test
Airline networks operate at global scale with constant change. Thousands of nodes and tens of thousands of edges shift daily. Graph analytics must maintain performance under that density. Traversal, centrality computation, clustering, and simulation must remain efficient.
If graph can model global air traffic networks, it can model complex enterprise ecosystems. The lesson is not about aviation. It is about structural reasoning at scale.
When systems grow interconnected, tabular abstractions become insufficient. Structure governs behavior.
Applying Graph Analytics to Enterprise Systems
Airline networks demonstrate how structure shapes performance, risk, and resilience. Enterprise environments operate under the same principles. Systems, identities, transactions, suppliers, and services form interconnected networks whose behavior depends on topology.
Graph analytics allows organizations to analyze these structures directly rather than reconstructing relationships through repeated joins.
Connect with TigerGraph to explore how graph analytics can help model complex enterprise networks, uncover structural risk, and analyze connected systems at real-world scale.
Frequently Asked Questions
1. What do Graph Analytics Reveal About Risk and Influence in Complex Networks?
Graph analytics reveal how risk and influence spread by analyzing relationships between entities, identifying critical nodes, pathways, and clusters that drive system behavior.
2. Why are Traditional Data Models Ineffective for Analyzing Interconnected Systems?
Traditional data models are ineffective because they treat data as isolated records, while interconnected systems require analysis of relationships and structure to understand behavior.
3. How can You Identify the Most Critical Nodes in a Network Using Graph Analytics?
You can identify critical nodes using centrality algorithms, which measure how much influence a node has based on its position within the network.
4. What does Connectivity Tell You About Risk Exposure Across a Network?
Connectivity reveals how risk propagates by showing how entities are linked across multiple steps, exposing indirect relationships and hidden dependencies.
5. How do Graph Analytics Improve Decision-Making in Complex Enterprise Environments?
Graph analytics improve decision-making by enabling organizations to model relationships, simulate disruptions, and analyze system-wide impact in real time.
In the rapidly evolving world of customer-facing businesses, providing an exceptional omnichannel customer experience has become the key to success. As online retail sales have soared over the last decade, it has become evident that connecting data across various silos is essential for a true omnichannel approach. In this blog post, we will explore how TigerGraph, a powerful graph database platform, is helping large customer-facing businesses create a connected customer platform, enabling them to leverage data effectively, improve customer interactions, and boost profits.
The Challenge of Consolidating Customer Data
Creating a comprehensive and coherent dataset that integrates everything known about customers, their purchasing behavior, and service usage is the foundation of a connected customer platform. However, consolidating these datasets is often a daunting task, and many businesses have struggled to achieve it successfully.
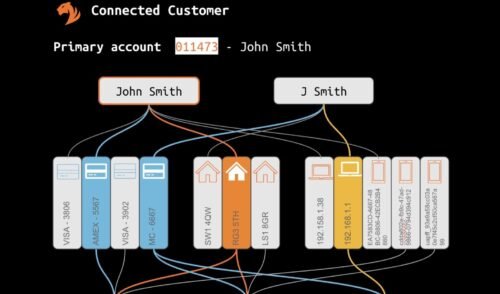
Retailers often face the challenge of dealing with messy customer data, multiple accounts for a single customer, and inconsistencies when they have grown through acquisitions. Moreover, purchase decisions are made at the customer or household level, but the data is often at a device or account level, leading to potential inaccuracies in models and insights.
The Power of Graph Databases
While traditional databases have failed to effectively connect data across silos, graph databases have emerged as a game-changer. Unlike traditional tabular databases, graph databases work on networks of connected data, allowing businesses to structure their databases as vast networks of customer-related information.
Graph databases offer several advantages in consolidating data, including:
- Flexibility: Graphs don’t impose a single structure on all records, enabling connections between data from different silos, even with inconsistent structures and many-to-many relationships.
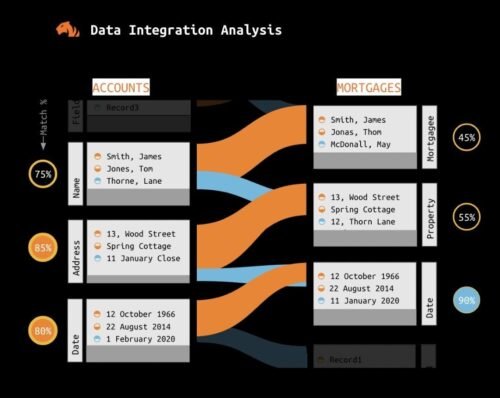
- Graph Entity Resolution: Using this technique, the graph can quickly identify likely matches between data from different systems, resolving them through fuzzy matching, address standardization, and machine learning.
TigerGraph: Transforming Customer Data and Driving Omnichannel Profits
TigerGraph has emerged as a leading graph database platform, delivering unparalleled performance and scalability. Its ability to handle real-life retail and banking datasets up to 30 times larger than its closest competitor and its remarkable speed, up to 1000 times faster, make it a perfect fit for large customer-facing businesses. A case in point of successful utilization of TigerGraph is demonstrated by these two enterprises, showcasing how they have effectively leveraged its capabilities.
- Multichannel Retailer: By leveraging TigerGraph, a large multichannel retailer was able to bring together data from five legacy acquisitions and connect family units of customers using multiple devices, payment cards, and addresses. This allowed them to market consistently across all customer touch points and resulted in a 17% increase in customer engagement.
- Global Media Conglomerate: Another success story involves a global multichannel media conglomerate that merged data from 15 independent divisions to create the first and largest identity graph in the advertising industry. This enabled them to target audiences with personalized commercials aligned with their interests, leading to improved advertising performance.
The importance of a connected customer platform cannot be underestimated in today’s customer-centric business landscape. TigerGraph is empowering large customer-facing businesses to consolidate data across silos, improve customer interactions, and drive omnichannel profits. As the platform continues to gain recognition and accolades, it remains a valuable asset for businesses seeking to deliver a true omnichannel customer experience.
If you’re interested in exploring how TigerGraph can transform your customer data and drive profits in your business, you can sign up for a free instance of TigerGraph Cloud at tgcloud.io or contact us at info@tigergraph.abstage.xyz.
Businesses need to stay ahead of the competition, to cut losses, and to find more revenue. By looking at their data as a network and then analyzing the connections – data about customers, products, operations – businesses are achieving those goals. Banks are cutting fraud by millions of dollars. Retailers are making more personalized and responsive product recommendations. Machine learning and AI tools are producing smarter results.
What is the secret here? Graph data and graph analytics. A graph is data in network form, such as a social network. Graphs capture the interdependencies and interrelations, and graph databases let you analyze that data much faster and much more accurately than other types of databases. The ability of graphs to improve analytics is something that businesses cannot ignore. Gartner has estimated that by 2025, graph technologies will be used in 80% of data and analytics innovations [2022 Gartner Market Guide for Graph Database Management Solutions]. Key use cases include financial crime detection, customer 360 with entity resolution, personalized recommendations, and modeling and optimization of operational systems and networks.
Learning and Understanding Graph Analytics
More and more people realize the need to include graphs in their business’ data operations and analytics, but they aren’t sure how to address that need. Most people grasp the concept and structure of graphs, but they’re not sure how to model their data or how to formulate their graph analytics. So we wrote a book: Graph-Powered Analytics and Machine Learning with TigerGraph. We were delighted to partner with O’Reilly, the premier name is computer science and technology educational media, to address this need.
This blog outlines what you’ll learn from this book and its accompanying hands-on examples with TigerGraph. Subsequent blogs will preview each of the blog’s three major sections.
Why This Book?
We designed this book with four objectives in mind:
- To speak to a range of readers, with varying technical backgrounds
- To address the needs of readers with different learning styles
- To fit the needs of readers with busy schedules
- To demonstrate using a platform that excels at graph analytics
First, we at TigerGraph hear from persons in a wide range of roles. Product managers and business professionals need to understand the business value of graph analytics, to find a fit for their needs and use cases. On the more technical side, graph analytics brings together professionals with several roles and backgrounds: Data application developers who know SQL and relational databases want to learn about graph databases and graph query languages. Data scientists and machine learning engineers who are well-versed in data analytics want to know when and how to add graph-based techniques. Engineering managers need to understand the resources and skills needed to have their team perform graph analytics.
Second, apart from your technical background, your learning style may be different from someone else’s. Some learners, like myself, are comfortable understanding material from a conceptual point of view and then applying it to use cases. Others are more attuned to starting from real examples and then generalizing to concepts. Some people learn best by doing a hands-on example.
Third, few of the people who are most interested in a book like this have the time to sit down and read a whole book!
To address these three needs – varying technical backgrounds, varying learning styles, and busy schedules – we came up with the following presentation style and format:
- Present material in two ways: concept chapters and hands-on use case example chapters.
- Introduce and explain concepts using visual aids and analogies to everyday ideas, with supplemental explanations for those with more technical background.
- Present examples in chapters that can be read independently, and out of order in some cases.
The book is structured as a three-part sequence – Connect, Analyze, and Learn – the three stages of sophistication in using graphs and graph analytics. Each part begins with a concept chapter which makes extensive use of analogies and figures so that readers with very little technical background can still follow. Then, each of the three parts has two or three hands-on use case examples. Each of use case chapters begins by presenting a business problem and why a graph-based solution makes sense. We then walk the reader through one of TigerGraph Cloud’s Starter Kits, so that they can see with real data and real queries how the graph analytics works and how it answers those business questions.
A reader who only wants to pick up on the big ideas could read just the concept chapters and skip the example chapters for now. A reader who knows the basics of graph queries and graph analytics but wants to know more about graph embeddings and graph neural networks could skim the first two concept chapters, then really dive into Part 3 – Learn. A reader who is focused on financial crime detection could read the tutorial on using GraphStudio (in Chapter 3), then jump to Chapter 5.
Why TigerGraph?
To address the fourth need – to demonstrate on an excellent graph analytics platform – that was easy. Use TigerGraph and GSQL. TigerGraph is the most scalable and fastest platform for graph analytics. The GSQL query language was designed to be both easy to learn for SQL users and to enable and perform sophisticated, high-performance graph analytics. Using TigerGraph Cloud removes the complications of installing and configuring software. Users only need to sign up for an account, and then they can deploy one free cloud database at a time, as well as pay-as-you-go databases if they wish.
Moreover, we make use of GraphStudio Starter Kits: pre-installed packages each containing a graph schema, graph data, and graph queries aimed at a particular use case, such as fraud detection, entity resolution, cybersecurity, or routing optimization. The queries are already written, so you can simply run them to see the results of the analyses. The book walks through the design of the queries, so that you learn the hows and whys of graph analytics. The combination of TigerGraph Cloud, GraphStudio, GSQL, and Starter Kits makes TigerGraph an excellent platform for showing hands-on use case examples for graph analytics
In our next blog, we’ll tell you more about Part 1 – Connect, as well previewing one of these use case chapters.
Enough preview. You can get a downloadable copy of the book for free from TigerGraph, so why not just see for yourself?
If you’re interested in exploring how TigerGraph can power better insights and better business outcomes, you can sign up for a free instance of TigerGraph Cloud at tgcloud.io or contact us at info@tigergraph.abstage.xyz.
It’s time for your enterprise to harness the power of graph technology.
A graph database platform – like TigerGraph – stores your data in intuitive, connected patterns so that queries run in seconds, instead of hours or days. By harnessing the power of connected data, TigerGraph unlocks the full potential of your data for applications as wide-ranging as:
Check out the full infographic to discover how TigerGraph takes your enterprise data capabilities from good to great.
Here’s a quick recap of the infographic above.
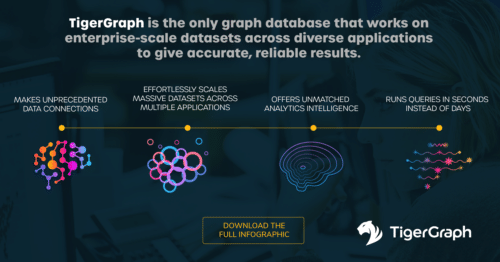
What Is TigerGraph?
TigerGraph is the only graph database that works on enterprise-scale datasets across diverse applications to give accurate, reliable results.
In brief, TigerGraph:
- Makes unprecedented data connections
- Effortlessly scales massive datasets across multiple applications
- Runs queries in seconds instead of days
- Offers unmatched analytics intelligence
TigerGraph Cloud, a DBaaS offering, makes the difference between being innovative and just spending time managing your software.
Recognition from Leading Industry Analysts
In its recent report, Gartner named TigerGraph as a new entrant in the Magic Quadrant and highlighted several areas where TigerGraph performs well.
For the first time, TigerGraph was named as a Niche Player in the November 2022 Gartner Magic Quadrant™ for Cloud Database Management Systems.
Other high marks from Gartner for TigerGraph’s industry-leading technology include:
- 4.5 stars for data science
- 4.0 stars for
- Distributed transactions
- Multi-model support
- Application development support
- 3.8 stars for relational attributes
- 3.5 stars for
- Data lake
- Programming automated transactions
- Analytics
- Operational intelligence
Empowering Enterprise Capabilities
TigerGraph goes above and beyond supporting enterprise data capabilities, including:
In turn, these capabilities help improve your enterprise use cases, such as:
The TigerGraph Difference
What makes TigerGraph different from other graph technologies? Here are the top three distinctions:
- High Performance
- Based on distributed architecture and advanced MPP native graph engine
- Fast data processing to unlock the value of connected data
- Strong scalability for a modern data analytics stack
- Continuous Enhancement on Graph AI & ML
- Built-in graph data science library and algorithms to support graph machine learning use cases
- An Ambitious Vision for Customers
- Increased scalability
- Real-time graph analytics for meaningful conversations with data
- Cloud ecosystem integrations to get deeper data insights
Enterprises Love TigerGraph
How do today’s leading enterprises use TigerGraph to make a bottom-line difference within their organization? Here are just a few examples:
- Intuit uses TigerGraph to reduce operating costs by 77%.
- Xandr makes 1 billion updates daily to its TigerGraph database.
- Amgen finds data inferences in 5 billion vertices stored in TigerGraph.
What could TigerGraph do for your enterprise team? Get started with TigerGraph Cloud and discover what’s possible with connected data.

Bank fraud is a serious concern that affects financial institutions and their customers worldwide. Large organized criminal groups are often the primary perpetrators of fraud, and understanding their tactics is crucial for effective detection and prevention. In this blog post, we will provide a clear and concise overview of bank fraud, its distinctiveness from anti-money laundering (AML), the two main types of fraud (loan and credit card fraud), and how TigerGraph’s detection methods contribute to combating fraud.
Fraud vs. AML: Fraud and AML may appear similar from a data and analytics perspective, but they have distinct commercial implications and are dealt with separately within banks. Fraud involves criminals misrepresenting their identity to steal money from the bank or its customers, primarily resulting in financial losses. AML, on the other hand, focuses on monitoring and reporting money movement to prevent criminals from hiding illicit funds, with non-compliance potentially leading to fines for banks.
Two Types of Fraud: Loans and Credit Cards: Fraud within the banking sector can be broadly categorized into two main types: loan fraud and credit card fraud. Loan fraud typically involves criminals setting up accounts, engaging in legitimate transactions until their credit rating allows them to borrow money, and subsequently absconding with the borrowed funds. Credit card fraud, on the other hand, encompasses criminals either applying for or taking over someone else’s card to withdraw cash or make purchases that can be resold for cash. In both cases, the intention not to repay the borrowed funds or settle the card charges constitutes the fraudulent act.
Detecting Fraud: There are two critical points at which fraud detection becomes crucial: during the application process and at the time of the fraud itself. Detecting suspicious accounts during the application stage involves assessing whether the provided information aligns with known patterns and connections to other suspicious accounts. Detection at the time of the fraud relies on identifying abnormal transaction patterns within the account, often in conjunction with changes in behavior observed in connected accounts.
Detection and Investigation: Fraud detection teams primarily focus on two activities: detection and investigation. Detection aims to identify suspicious accounts and activity through automated means, often utilizing machine learning algorithms. The challenge lies in striking a balance between detecting as much fraud as possible while minimizing false positives and not mistakenly flagging genuine customers as fraudsters. Investigation, on the other hand, involves confirming whether a suspicious account is indeed involved in fraudulent activities. This step typically requires human intervention by trained fraud investigators and can be resource-intensive due to the complexity and volume of transactions associated with fraudulent accounts.
TigerGraph’s Contribution to Fraud Detection: TigerGraph, a leading provider of fraud detection solutions, employs various methods to detect and combat bank fraud effectively. One crucial step is consolidating information to establish connections between accounts and transactions, enabling the identification of suspicious individuals and groups. TigerGraph leverages advanced techniques such as Shortest Path, (Personalized) Page Rank, Louvain Community, and Weakly Connected Components to assess the proximity of an account to known suspicious accounts, determine its centrality in a network, and identify connections to suspicious groups.
Additionally, TigerGraph’s behavioral analysis focuses on monitoring changes in account activity in real-time, both for the account in question and its closely connected accounts. By analyzing transactional behavior and detecting significant changes, TigerGraph’s system can flag potentially fraudulent activities promptly.
Conclusion: Understanding bank fraud is crucial for financial institutions to protect themselves and their customers from significant financial losses. Distinguishing fraud from AML, recognizing the two main types of fraud (loan and credit card), and comprehending the crucial points of detection can aid in implementing effective countermeasures. With its advanced detection methods and focus on consolidating information and analyzing behavior, TigerGraph contributes to the fight against bank fraud, offering financial institutions the tools they need to detect and prevent fraudulent activities in a timely and cost-effective manner.
For more questions, and to connect to our team, please contact us at info@tigergraph.abstage.xyz.
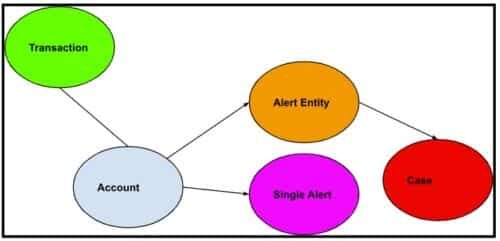
Figure 1: AML generic workflow.
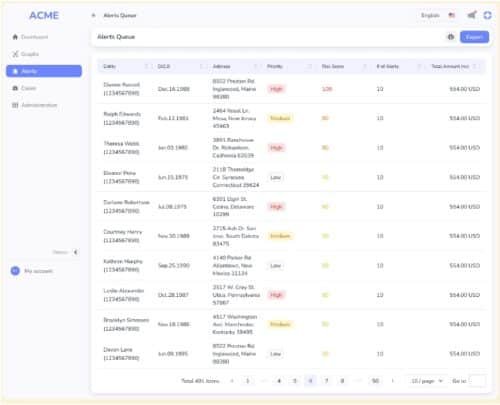
Financial accounts are linked to many transactions. Alert entities are suspicious accounts that are presented to fraud analysts, who can further put alert entities into a case study container.
Introduction
In the world of finance, preventing money laundering is of paramount importance. This blog aims to provide insights into how financial institutions implement Anti-Money Laundering (AML) practices using graph databases. By examining the relationship between commercial accounts, consumer accounts, and their associated financial transactions, we can better understand the steps involved in combating money laundering.
We also observe that although AML software is subject to compliance regulations, its impact on the financial institutions’ overall revenue may not be direct. However, it is worth mentioning that the same techniques and frameworks employed in AML software can be effectively utilized to identify instances of fraud and minimize the number of false positives encountered by fraud analysts. This, in turn, alleviates the workload on analysts and leads to significant operational cost savings for financial institutions.
Accounts and Transactions
Financial institutions serve both commercial and consumer customers, each having their respective accounts (blue node). These accounts are linked to numerous financial transactions (green node), including deposits, withdrawals, money transfers, and more. By analyzing these transactions, institutions can identify suspicious activities indicative of money laundering.
Steps to Combat Money Laundering
1.Run an entity resolution algorithm on all accounts based on common address, common phone, common ssn etc. to detect identical or similar accounts and merge them into one entity.
Note: This step is easy in TigerGraph GSQL, but not easy by relational database or Neo4j Cypher. This is a graph clustering algorithm problem, GSQL’s accumulator makes it easy.
2. After grouping all accounts, the transactions of each account group will be used to generate single alerts (pink node). Each alert means some rules are violated. Common rules are:
- Does the account have a transaction that has been marked as fraudulent?
- Does the account reside in a group whose group size is 100 or above? Looks like a non-human natural setup!
- Does the account have international wire transfer (inbound or outbound) passing a threshold? Red flag!
Note: This is a 1-hop aggregate query, it check each account’s transactions, and insert into the graph a “single alert” node, and connect the newly created node with the account node. GSQL supports insertion of nodes and edges.
3. Based on the generated alerts, risk scores are calculated for each account group. These risk scores provide an overall indication of the associated risk level. If an account group’s risk score exceeds a predefined threshold, an “Alert Entity” node is created. Such entities are subjected to thorough scrutiny by alert analysts. Alert analysts can further create a “case” node to group a set of related alert entities.
Note: This is a 1-hop aggregate query, it check and aggregate each account’s single alerts, and insert into the graph “Alert entity” node, and connect the newly created node with the account node. GSQL supports insertion of node and edges.

4. Case analysts can further examine the case for further fraud study.
Why Graph Database
Entity resolution is easier. Fraudulent users have finite physical resources– IP, device, residential address, SSN etc. By grouping accounts based on those finite resources, we can find suspicious account groups that are artificially manipulated by fraudsters. Graph database can naturally run a weakly connected component algorithm or other unsupervised cluster algorithms to find such account groups, which is hard in relational database.
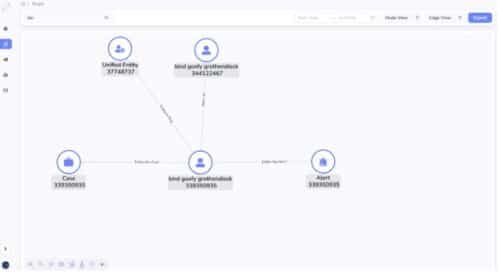
Avoid ad hoc joins. Graph storage format is just a better way to manage data. Why? Essentially, unlike relational databases which do runtime join to connect table rows at a per query basis, graph database obviate the runtime join for all queries. Instead, graph database materialize all joins at loading time. When you finish the initial data ingestion, or you do incremental data ingestion, each insertion materialize a relationship. At runtime, you just traverse the edge (relationship) for a source to a target, you never need to do a join for two vertices that you know they have a relationship. For example, in step 2 above, if you use a graph database, you just aggregate all transactions following the edges from the transactions to their linked accounts. But in relational databases, you need to join the transaction table with the account table to achieve this. In step 3 and 4 above, when alert entity or case are presented to the fraud analysts, they will double click the alert entity or the case, which brings them to a graph (network) exploration panel, the alert entity’s 1-hop neighborhood will be unfold on the screen (no join for graph database here, but will trigger a runtime join for relational database query engine), and the analysts can continue her ad hoc double click to investigate the traces of the alert entity, 3-hop, 4-hop etc., all have not join cost for graph database, but a join cost for relational database. In other words, graph database storage is just smarter, in that it can avoid repetitive runtime joins by materializing joins as edges. It is just greener for the planet.
Why TigerGraph
Scalability: transactions are large, can be 500G to 10T. TigerGaph has been proven to be capable to handle 100T challenging multi-hop queries.
Performance: MPP architecture can do this AML flow parallelly for all accounts. It’s a data mining problem involves both unsupervised clustering and semi-supervised rule filters. You need to examine each account and its transactions.
Advanced Aggregation support from Query Language: GSQL query language’s accumulator ingredient makes this ad-hoc vertex-centric aggregation easy. I don’t see how other query languages can do this. The closest one may be SQL stored procedure, but it’s not as good as an accumulator since graph query is vertex oriented, we need to leave side-effects (runtime attributes) on vertices for later iteration examination.
Mutability: TigerGraph allows queries to insert nodes and edges. This makes alert and case generation possible.
Contact
If you need to see an AML demo, please contact us here info@tigergraph.abstage.xyz.