In the rapidly evolving landscape of data analytics and artificial intelligence (AI), the recent talk by Dan McCreary, Head of AI at TigerGraph, at the NVIDIA GTC event stands out as a significant milestone. His presentation, titled “Enhanced Data Analytics: Integrating NVIDIA Rapids cuGraph with TigerGraph,” shed light on the critical importance of graph databases in AI and the groundbreaking work TigerGraph is doing in collaboration with NVIDIA. This blog dives into the key insights from Dan’s talk and the implications for the future of AI and data analytics.
The Critical Role of Graph Databases in AI
Dan McCreary kicked off his presentation by emphasizing the crucial role of graph databases in the realm of AI. Graph databases, unlike their relational and non-relational counterparts, are designed to handle highly interconnected data efficiently. This characteristic makes them particularly suited for applications that require the analysis of complex relationships between data points, such as fraud detection in banking—a field where TigerGraph has already marked its prowess with several successful implementations.
Drawing inspiration from Jeff Hawkins’ theories on the brain, as outlined in his books, Dan used a poignant quote to set the stage: “The key to artificial intelligence has always been the representation.” This statement highlights a fundamental challenge in AI: accurately modeling and representing the data in a way that machines can effectively process and learn from.
Navigating the Representation Problem in AI
Dan’s talk delved into the representation problem in AI, a crucial hurdle to achieving more advanced and efficient AI systems. He identified four key types of data representations used in AI today: images, sequences, tables, and graphs. Each of these representations has its domain of applicability and associated challenges, but Dan’s focus was on graph representations due to their ability to model complex relationships and dynamics.
One of the main challenges with graph data is its inherent sparsity and the difficulty of optimizing these representations for hardware. This is where the collaboration between TigerGraph and NVIDIA becomes pivotal. Dan walked the audience through the complexities of dense and sparse matrix representations and discussed the journey towards achieving a fully hardware-optimized graph system.
Leveraging NVIDIA’s RAPIDS cuGraph for Breakthroughs in Performance
The partnership between TigerGraph and NVIDIA has been instrumental in addressing the challenges of graph data analytics. Dan highlighted how TigerGraph is leveraging NVIDIA’s RAPIDS cuGraph libraries to tackle the problems associated with sparse matrix representations. The discussion touched upon the pros and cons of using Python for these tasks but underscored the substantial performance improvements enabled by NVIDIA’s RAPIDS libraries.
A highlight of Dan’s presentation was the demonstration of up to 100x speedups in performance when utilizing NVIDIA GPUs for algorithms like PageRank. This impressive achievement underscores the potential of graph analytics when combined with powerful hardware acceleration, offering a glimpse into the future of AI where graph representations play a central role.
The Synergy Between TigerGraph and NVIDIA: Pioneering the Future of AI Hardware
In closing, Dan McCreary expressed his gratitude towards NVIDIA for their partnership. This collaboration is not just about achieving short-term gains in performance but about jointly paving the way for the next generation of graph-optimized hardware. By combining TigerGraph’s expertise in graph database technology with NVIDIA’s leadership in GPU technology, the two companies are at the forefront of creating solutions that can handle the complexity and scale of tomorrow’s AI challenges.
The significance of Dan McCreary’s talk at NVIDIA GTC extends beyond the technical details of integrating cuGraph with TigerGraph. It represents a pivotal moment in the evolution of AI and data analytics, highlighting the shift towards graph representations as a key enabler of more sophisticated and effective AI systems. As companies increasingly migrate to graph representations to enhance their predictive capabilities, the work being done by TigerGraph and NVIDIA will undoubtedly play a crucial role in shaping the future of AI.
In an era where the ability to analyze and leverage complex relationships in data can provide a competitive edge, the advancements discussed in Dan’s presentation offer exciting possibilities. Whether in detecting banking fraud more accurately or in understanding customer behaviors and product dynamics, the integration of NVIDIA Rapids cuGraph with TigerGraph is setting new benchmarks for what is possible in AI and data analytics.
The journey towards a future where AI can more closely mimic the intricacies of human intelligence and decision-making is fraught with challenges. Yet, with visionaries like Dan McCreary leading the charge and fostering collaborations between industry giants like TigerGraph and NVIDIA, the path forward seems not only clearer but also significantly more promising. As we look ahead, the continued innovation in graph database technology and hardware optimization heralds a new era for AI—one that is more intelligent, efficient, and capable of understanding the complex web of relationships that define our world.
As the Head of Marketing at TigerGraph, I’m thrilled to extend a warm invitation to all enthusiasts, professionals, and curious minds to join us at the upcoming Graph + AI Summit 2024. This event is an absolute must for anyone interested in leveraging the transformative potential of graph technology and artificial intelligence. Here is why:
1. Exclusive Announcements and Sneak Peeks: As a participant of Graph + AI, you’ll be among the first to hear about our latest product announcements, updates, and future roadmap plans. Get exclusive access to sneak peeks, beta releases, and insider information straight from the source.
2. Great Networking Opportunities: At Graph + AI Summit, you’ll have the chance to connect with the industry leaders, innovators, and experts in the fields of graph databases and artificial intelligence. Rub virtual shoulders with professionals from organizations like Mastercard, KPMG, and JPMorgan Chase & Co, among others. Whether you’re a seasoned professional or just starting your journey, networking with like-minded individuals can open doors to collaborations, partnerships, and invaluable insights.
3. Cutting-Edge Insights and Case Studies: Our event will feature keynote speeches, panel discussions, and workshops led by top thought leaders and practitioners. Gain firsthand knowledge from real-world case studies showcasing how leading organizations are leveraging the synergy between graph databases and AI to drive innovation, solve complex problems, and unlock new opportunities.
4. Exclusive Insights from Industry Visionaries: We are honored to have Hamid Azzawe, TigerGraph’s CEO, to present at the event. With a wealth of experience from Meta, Amazon, Microsoft, Bloomberg, RBC, AMFAM, and IBM, Hamid brings a unique perspective to the table.
5. Hands-On Workshops and Demos: Explore the practical applications of graph technology and AI through interactive workshops and live demonstrations. Whether you’re interested in building recommendation systems, fraud detection algorithms, or knowledge graphs, our workshops will provide you with the tools, techniques, and best practices you need to succeed.
Graph + AI Summit isn’t just another event—it’s a gathering of passionate individuals united by a common goal: to unlock the full potential of graph technology and artificial intelligence. Join us on this exciting journey of discovery, collaboration, and innovation. We can’t wait to see you there!
Save the Date: May 1-2, 2024
Location: virtual
Many executives are pondering difficult decisions about making large investments in AI. For many of them, their lack of a technical background makes it difficult for them to visualize the impact of AI on their customers, their products, and their employees. To help executives make the right strategic decisions, we need powerful storytelling in terms they can understand and remember.
I have been creating a set of stories and metaphors to guide executives when they need to make strategic decisions about AI investment. After testing, my Jellyfish and Flatworm story has been remarkably effective at helping them guide their peers. I would appreciate feedback from my readers if this story is sticky enough to guide your leaders.
At the core, this story is about why Knowledge Representation (KR) must be the core of any cost-effective long-term AI strategy. We will see how Large-Language Models (LLMs), Knowledge Graphs (KGs), and Reference Frames (RFs) are moving us closer to general AI and how building hybrids of these three knowledge representation strategies is the best path.
At the end of this story, you can start to ask if your organization is more like a jellyfish or a flatworm. Clues about how much you need to invest in AI will be clear. Let’s begin our story.
The Evolution of Animal Intelligence
About 600 million years ago, animals evolved cells that helped them react to environmental changes. Let’s start with the elegant jellyfish. Jellyfish live in the open ocean, far away from complex structures. A jellyfish only needs simple rules to navigate its environment. Jellyfish might move to depths that allow them to capture more prey and avoid their predators. But they are not hunters. They depend on fish drifting into their tentacles.
Jellyfish live in a relatively simple environment and need to be efficient with their energy use. They really don’t need a complex centralized nervous system to help them navigate the ocean. If jellyfish had a big complex brain that required energy, they would quickly starve. To survive, they needed to keep things simple.
In contrast, on the ocean floor, things were getting much more complicated. To seek their prey and avoid predators, animals like flatworms started to develop muscles to help them move around. They also developed more cells on their skin that could process complex signals such as light, temperature, and smell. They used these sensory systems to get detailed information about their environment. And like the jellyfish, they also developed rules to survive. But not all the rules stayed simple. Knowing both what rules to follow and when to follow them became more complex.
Flatworms are thought to be the first hunters.
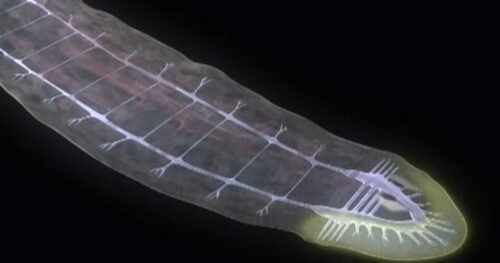
Movement and the Evolution of the Central Nervous System in Flatworms

Then something really interesting started to happen. Flatworms started to centralize where these rules were executed. Putting them all near their front-facing sensors made sense. We now call that the “head” of our animals. They started to evolve a complex network of centralized nerve cells, which we now call a centralized nervous system or CNS in their heads. These networks of communicating nerve cells evolved to become the brains of animals that move about in the world.
So why did they need to build such complex and energy-consuming cells? The key thing to understand is that movement makes executing rules complicated. Like an anemone, a plant sits in a single location on the ocean floor. It does not need to understand how things change if it moves. But any animal that moves needs to start to learn the structure of its environment. If it turns around 180 degrees, it needs to know that this helps it move away from predators. The bottom line is that we can’t really understand animal intelligence without having a deep appreciation for understanding how intelligence and models of our world are tied to motion and, importantly, maps and structure.
The Evolution World Models in Brains
Let’s explore why storing models of the world around it gave these flatworms a competitive advantage over their siblings. We ask, how can we have more precise ways to know what rules to execute and when to execute these rules in order to survive?
Imagine two flatworms. One that had a precise model of the world around them in their brain, and another that did not have a precise model. As these animals crawled out of their holes to seek their prey, those with a more precise model would remember where the best food was. They could also remember where predators threatened them. You can think of these models as internal maps of a flatworm’s surroundings. They used these models to give themselves a competitive advantage. They had more offspring, and these offspring also built more precise models of the world around them. We call these models “world models” because their structure represents the world around them.
The key point here is that these early nervous systems evolved into many other much more complex systems that have become our brains. Humans out-competed our extinct ancestors because we could model the world and predict how our actions could help us survive and out-compete our rivals. Modeling what is in our prey or predator’s brain can also be very helpful for survival. Does that mammoth think strategically about the consequences of being headed toward a cliff?
In summary, animals have brains that are predictive organs that must model their world and build mental maps of their world. These models advise us on what actions to take to help us survive. They also give us advice on the consequences of we don’t think strategically about the complex systems around us.
Let’s apply what we learned about jellyfish and flatworms to our organization.
Language Models Are *Not* World Models
Now, you might ask, “What does this all have to do with AI?” Much discussion has been about LLMs and how they are used to generate text. But these language models are fundamentally different from the world models in our brains. Let’s consider how they are different.
LLMs are used to predict the next word given a sequence of preceding words. They were never designed to store accurate models of the real world. Language is a collection of symbols we use to describe our world. When we need to communicate ideas between people, we generate sequences of words that fit within patterns called grammar and syntax. Although tools like ChatGPT and Llama 2 are incredibly useful, they were never designed to model the world and simulate the impact that our actions would have on the future states of our worlds.
Don’t get me wrong here. I love my GPT-4! But we must be clear. Modeling language is only a shadow of how we communicate about the world. It really is not a precise model of the world. It can be complemented with actual models of the world, but fundamentally, the knowledge representation distributed through billions of weights in a neural network has severe limitations with precision, reproducibility, truthfulness, performance, and explainability.
Knowledge Graphs *ARE* World Models
Many of my readers know that I have been deeply involved in building large-scale Enterprise Knowledge Graphs (EKGs) for the last six years. Before that, I wrote books on the tradeoffs of using various NoSQL databases. I am a person who can quickly visualize how knowledge is represented in computers, and my goal is to explain the tradeoffs of these alternative representations.
Knowledge graphs are the closest thing we have today to modeling our world in computers. Oh, and by the way, if you pick the right graph database, you can get it to scale out over hundreds of servers. Google, Amazon, LinkedIn (Microsoft), and even Pinterest have proven this for over ten years.
Just like the flatworm needed to model the structure of their environment by building precise maps, knowledge graphs are also the best way for us to manage structure. This can be the structure of our customers, our products, and our competition.
Animal Brains Use Reference Frames
Now, we come to the most interesting fact. Our brains don’t really store data like large-language models or knowledge graphs. We store knowledge in a form that evolved from building maps of our world. These are called Reference Frames and are described clearly in Jeff Hawkin’s book A Thousand Brains. Unlike an LLM, their knowledge can be continually updated. And just like scale-out distributed knowledge graphs, their processing is done in parallel. I won’t go into too much detail on reference frames here but look to innovative companies like Numenta to combine reference frames with LLMs to build new AI systems.
The take-home point is that reference frames can teach us many things about intelligence and how we need to use maps and structure to help us make better predictions. There will be more to come on this topic in future blog posts.
Measuring Complexity In Your Organization

So, should you be building a model of the world in your internal computer systems? Let’s take a look at what a simple company might be.
Imagine you supply a single specialized part to another manufacturer. You are good at what you do and get the same contract every year. You don’t really have any competition. I would describe this company as living in a simple environment, much like the jellyfish living in the open ocean. We can call this company a “jellyfish company.” You can probably model your organization using a spreadsheet or a relational database that uses flat file representation of the world with a few very slow JOIN operations if things get complicated. Your IT department doesn’t need a huge budget.
Now, let’s look at a more complex company. One that has many customers sells many products, and these products each have many competitors. Their structure might look like the following:
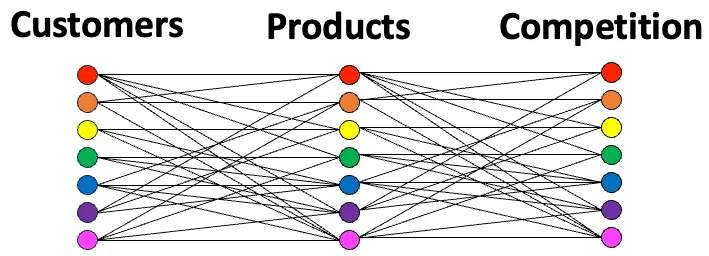
You can see that you need a complex model of your world to sell your products in a highly competitive landscape to many types of consumers. You are more like a flatworm company than a jellyfish company. You need complex models that include structure, relationships, precision, explainability, and the ability to add new complexity at will.
How you manufacture and market your products can be dauntingly complex. Can you simulate the impact of a price increase on one of your products? Are you modeling customer behavior? Can you predict the impact of a new marketing campaign? Can you explain why sales of some items are dropping off? If you can’t do this today, it might be that your model of the real world is too simple and too flat without structure. You might need to invest in using a combination of knowledge graphs and LLMs to accelerate your ability to predict the future.
Conclusion
Today, we are seeing unprecedented investments in artificial intelligence. The first wave is mostly investment in tools to make it easier for firms to build intelligent agents that help worker productivity. But all the agent software in the world might not help if your data is trapped in spreadsheets and siloed data. Knowledge needs to be centralized and connected.
Today, jellyfish companies are exceedingly rare. Most companies must deal with rapidly evolving complexity and make precise predictions that require accurate models of the world around them. Companies must focus on building the foundations that will power thousands of intelligent agents working together on centralized knowledge. And remember, going to the cloud will not save you if you have 1,000 silos.
Let me know if this story works for you. Can you tell this story to executives and ask them “are we a jellyfish or a flatworm company”? Ask them if a centralized knowledge graph would help them answer hard questions about their customer, products and competitors.
If you would like to hear how TigerGraph can help your organization build a centralized nervous system, contact us at info@tigergraph.abstage.xyz. re
The world has always been built around connections, but the world today is more hyper-connected than ever before.
Tapping into the power of these rich, growing networks – whether that be financial transactions, social media networks, recommendation engines or global supply chains – will make or break the bottom-line of tomorrow’s leading enterprises.
Given this critical importance of connections in the modern business environment, it’s about time that our database technology kept up.
Legacy databases (known as relational databases or RDBMS) were built for well-mapped, stable and predictable processes like finance and accounting. These databases use rigid rows, columns and tables that don’t require frequent modifications, but when the database model does need to change, it’s an expensive hassle.
But today’s business world is in regular flux – change is the only constant. When building software applications, business and user requirements change all the time. And yet, most legacy database software fights against these changes rather than evolving with them.
Enter graph databases. The graph database model is built to store and retrieve connections from the ground up. It’s more flexible, scalable and agile than RDBMS, and it’s the optimal data model for applications that harness artificial intelligence and machine learning. AI and ML thrive on connected data, and that’s exactly what graph technology delivers.
So, what’s a graph database and what’s it good for? I’m so glad you asked.
What Is a Graph Database?
A graph database stores two kinds of data: entities and the relationships between them.
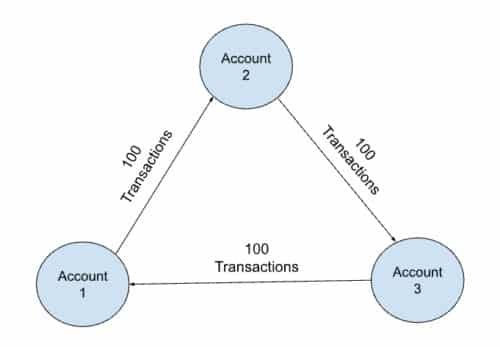
Data entities are stored as vertices (or sometimes nodes) and data relationships are stored as edges. Vertices represent nouns: people, places, products, locations, payments, and more. Edges represent the verbs or relationships that connect various vertices. This network of interconnected vertices and edges is called a graph.
For example, a customer (vertex) has (edge) an shopping cart (vertex). The edge has connects the customer vertex and the shopping cart vertex.
Here’s another example: An app user (vertex) sends (edge) a payment (vertex) directed to (edge) another app user (vertex). The two app user vertices are connected to the payment vertex via the sends edge and the directed to edge, respectively.
In addition, vertices can have attributes which add more details to each record within a vertex. For instance, a customer vertex might have attributes like name, phone number and credit card number.
Graphs are often best understood visually. The images below are all graphs of vertices and edges that are stored in a graph database.
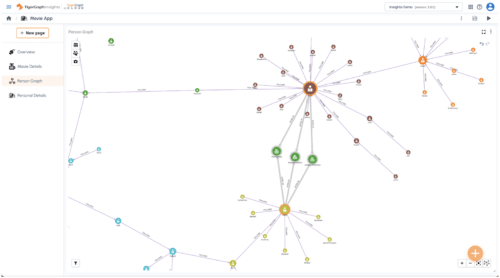
Graph database software stores all the records of these interconnected vertices, attributes, and edges so that they can be harnessed by various software applications. In other words, graph databases store networks of interrelated data.
What Is a Native Graph Database?
As graph technology grows in popularity, more and more database vendors offer “graph” capabilities alongside their existing data models (such as relational, document, wide column, key-value or other NoSQL stores). But the trouble with these graph add-on offerings is that they’re not optimized to store and query the connections between data entities.
If your application frequently needs to store and query data relationships, then you need a native graph database.
The key difference between native and non-native graph technology is what it’s created for. A native graph database – like TigerGraph – uses something called index-free adjacency to physically point between connected vertices in the database. This ensures connected data queries are highly performant.
Essentially, if a database model is specifically engineered to store and query connected data then it’s a native graph database. If the database was first engineered for a different data model and only added “graph” capabilities later, then it’s a non-native graph database.
Non-native graph data storage is often slower because all of the relationships in the graph have to be translated into a different data model (and then back again) for every graph query.
While these differences might not appear critically important, it all comes down to why you’re using a graph database in the first place.
Why Use a Graph Database?
If your application frequently queries and harnesses the relationships between users, products, locations, or any other entities, then you’re better off using a best-in-class native graph database. The same is true if your use case leverages network effects or requires multiple-hop queries across your data.
A graph database is quicker for your development team to modify and quicker for your application to query. Graph database technology also grows and evolves alongside your business and application requirements – it never lags behind or gets stuck in the past.
And it almost goes without saying that if your enterprise relies on graph analytics or graph data science, then you need a native graph database to ensure real-time performance for mission-critical applications.
What Are Graph Databases Used for?
The real question is what are graph databases not used for? The use cases for graph technology are vast, diverse and growing. Here’s a rundown of some of the most popular graph database use cases out there today:
Most Popular Graph Database Use Cases:
Increase Revenue:
Reduce Costs & Manage Risks:
Improve Operational Efficiency:
Foundational Technology:
…and a lot more! Graph technology is a tool to build the future, so there’s no limit to the use cases you might discover.
Who’s Already Using Graph Databases?
Graph databases have been skyrocketing in popularity for more than a decade, and everyone from enterprises organizations to innovative startups is tapping into the power of graph technology.
Here are just some of the leading companies who are already using graph database technology to deliver value to end-users and dominate their industries:
- Intuit: AI-powered knowledge graph
- JPMorgan Chase: fraud detection
- Microsoft Xbox: customer experience
- Ford: entity resolution
- Amgen: social network analysis for healthcare
Of course, these are only a few of the many cutting-edge organizations using graph databases to harness connected data. Discover more graph database users and use cases on the TigerGraph Customers page.
Conclusion
Our world is shaped – and powered – by connections, so it’s time your database software catches up to reality. In fact, graph databases mimic the pattern-matching functions of how the human brain maps the world through neurons (vertices) and synapses (edges). It’s this human-intuitive data model that makes graph technology so unique and powerful.
No matter what your enterprise’s core business, it can be enhanced with the power of connected data. And if your team can tap into the power of data relationships today, you’ll be well ahead of the competition come tomorrow.
If you have any questions, or would like a demo, please contact us at info@tigergraph.abstage.xyz.