Major Financial Institution Improves Its Ability to Combat Money Laundering with TigerGraph
his company provides banking, investment, mortgage, trust, and payment services products to individuals, businesses, governmental entities, and other financial institutions. It is one of the largest banking institutions in the United States, and has over 3,000 branches, primarily in the Western and Midwestern United States.

The Challenge
The financial institution was looking to improve its networking and link analysis capability for anti-money laundering to be applied in three ways:
The Solution
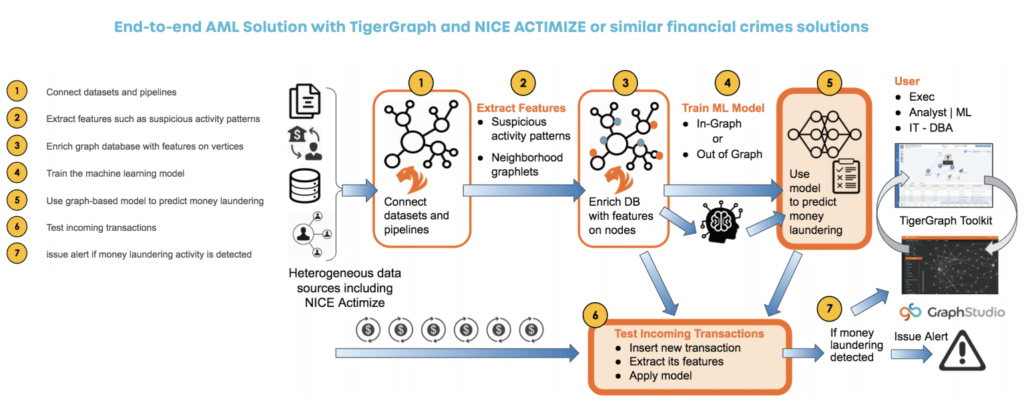
TigerGraph is providing this financial institution with the ability to perform in-depth analysis that was impossible with its prior legacy system based on a relational database.
The Results
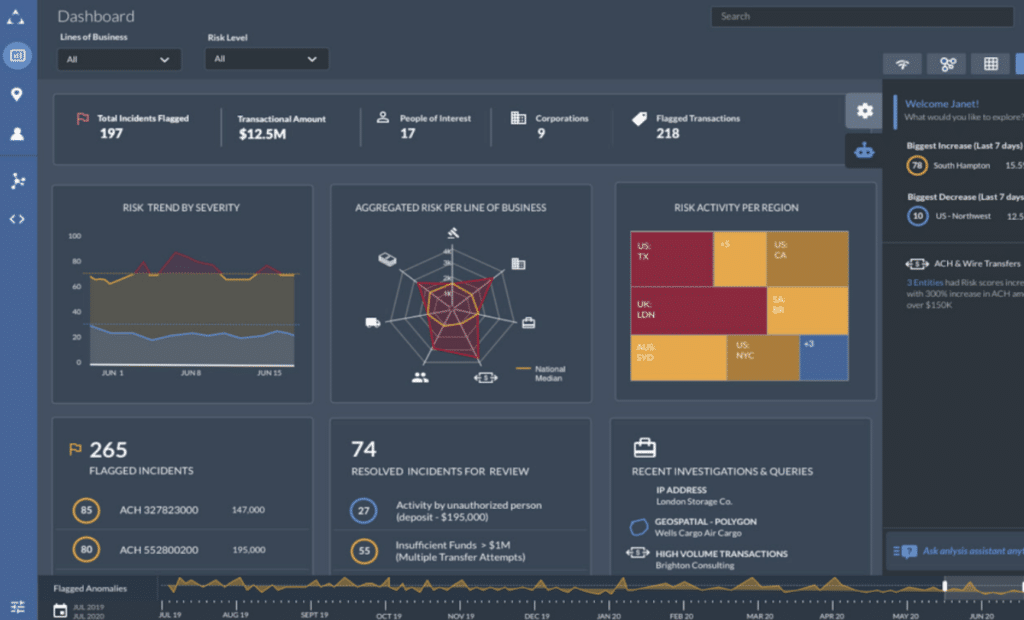
Although only in production for months, this company is experiencing an improvement in the ability of its analytical and investigative teams to identify and trace connections between work items that are indicative of money laundering and react in realtime.
The Challenge
The financial institution was looking to improve its networking and link analysis capability for anti-money laundering to be applied
in three ways:
Connections between open work items in situations of interest (such as previous SAR filings, other open work items) should be identified and available to analysts and investigators; Thorough ad hoc reviews of an entity should display the connections from an ecosystem surrounding a specific starting point of an investigation; The system should enable analysts to identify which connections and situations of interest lead to productive investigations and inform the creation, hibernation, or escalation of work items.
The company examined a number of alternatives in the hope of finding one that offered a client-focused approach, state-of-art technology and next generation database management solution that integrated seamlessly with its existing workflow.
The Solution
TigerGraph is providing this financial institution with the ability to perform in-depth analysis that was impossible with its prior legacy system based on a relational database. TigerGraph offers the capability for this business to see its connected data in context. Moreover, TigerGraph is delivering the scalability to analyze ever-increasing amounts of data and an extensibility derived from its support for machine learning that keeps the bank’s anti-money laundering program ahead of financial criminals.
By deploying TigerGraph on AWS and the result is a scalable, high-performance system that allows them to quickly deliver real-time insights into complex relationship-based workflows that are common in tasks such as credit scoring, fraud detection, recommendation engines and risk analysis.
By deploying TigerGraph on AWS and the result is a scalable, high-performance system that allows them to quickly deliver real-time insights into complex relationship-based workflows that are common in tasks such as credit scoring, fraud detection, recommendation engines and risk analysis.
The Results
Although only in production for months, this company is experiencing an improvement in the ability of its analytical and investigative teams to identify and trace connections between work items that are indicative of money laundering and react in realtime. This is improving the effectiveness and efficiency of these teams, and further substantial gains in productivity are resulting from their ability to determine which situations of interest to prioritize.
The data sciences team at Amgen is now able to support its colleagues in marketing and branding with the insights they need about the referral networks and influential doctors and ensures everyone is fully informed about the medicines that can positively affect the quality of care of millions of patients.
The data sciences team at Amgen is now able to support its colleagues in marketing and branding with the insights they need about the referral networks and influential doctors and ensures everyone is fully informed about the medicines that can positively affect the quality of care of millions of patients.


Ready to Harness the Power of Connected Data?
Start your journey with TigerGraph today!