Contact Us
Back to Blog

Rajeev Shrivastava

CHIEF EXECUTIVE OFFICER

Rajeev brings extensive leadership experience from top technology companies. Previously, he drove significant growth and innovation at Google and NICE inContact, leading major strategic initiatives and successful mergers. His expertise in scaling businesses and fostering innovation is underpinned by an MBA from the Wharton School and a Bachelor’s degree from Delhi College of Engineering. Prior to joining TigerGraph, Rajeev was at Google, where he served as GM & Product Lead for an AI-first Customer Conversation Platform. In this role, he managed a significant P&L and led teams driving innovation and growth within Google’s expansive business landscape. Previously, Rajeev played a pivotal role in the growth of NICE inContact as their Chief Product & Strategy Officer. Prior to NICE inContact, Rajeev led go-to-market and marketplace initiatives at Rackspace.

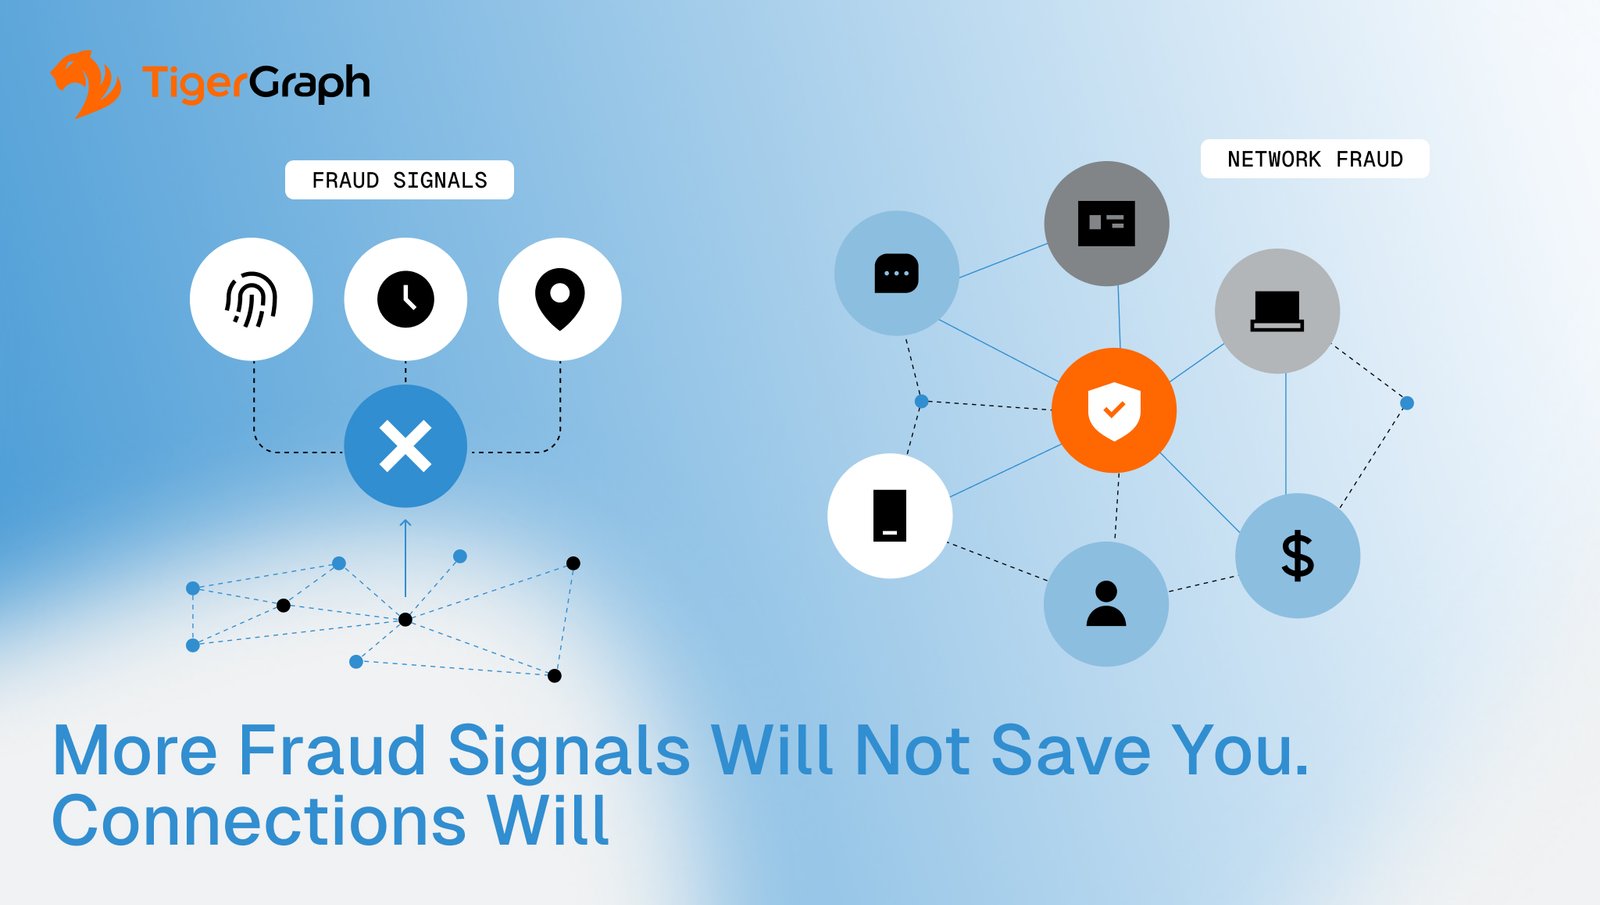
A graphic shows icons for fraud signals and connected network devices, with the text: More Fraud Signals Will Not Save You. Connections Will. The TigerGraph logo appears in the top left corner.
More Fraud Signals Will Not Save You. Connections Will.
Discover
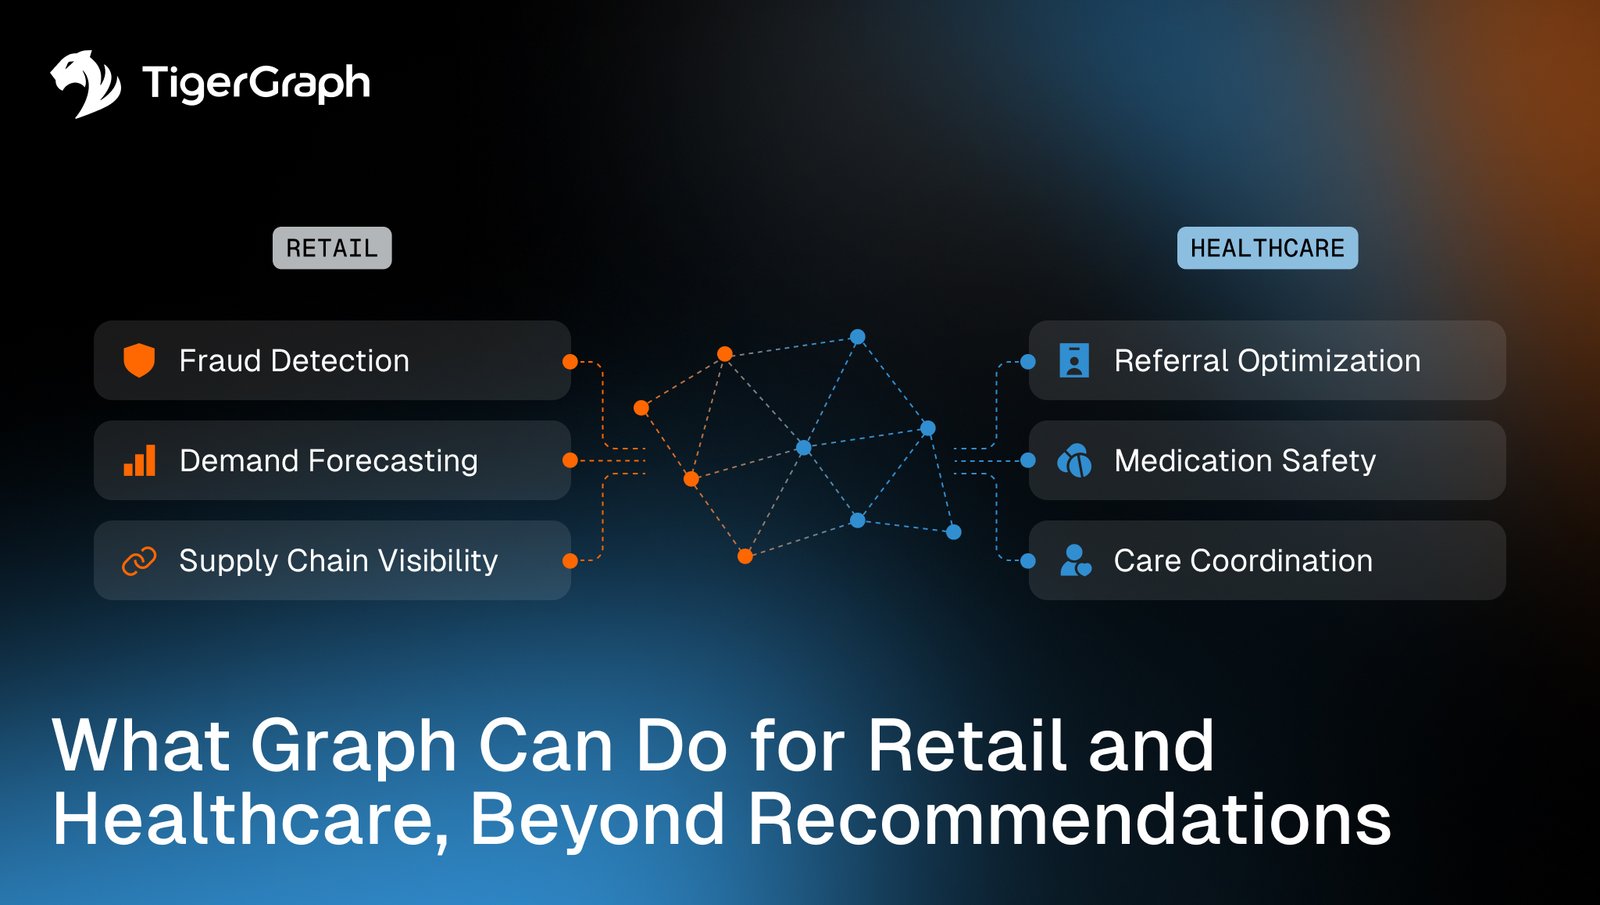
An infographic by TigerGraph shows how graph technology benefits retail—fraud detection, demand forecasting, supply chain visibility—and healthcare—referral optimization, medication safety, care coordination—beyond recommendations.
What Graph can do for Retail and Healthcare, Beyond Recommendations
Discover
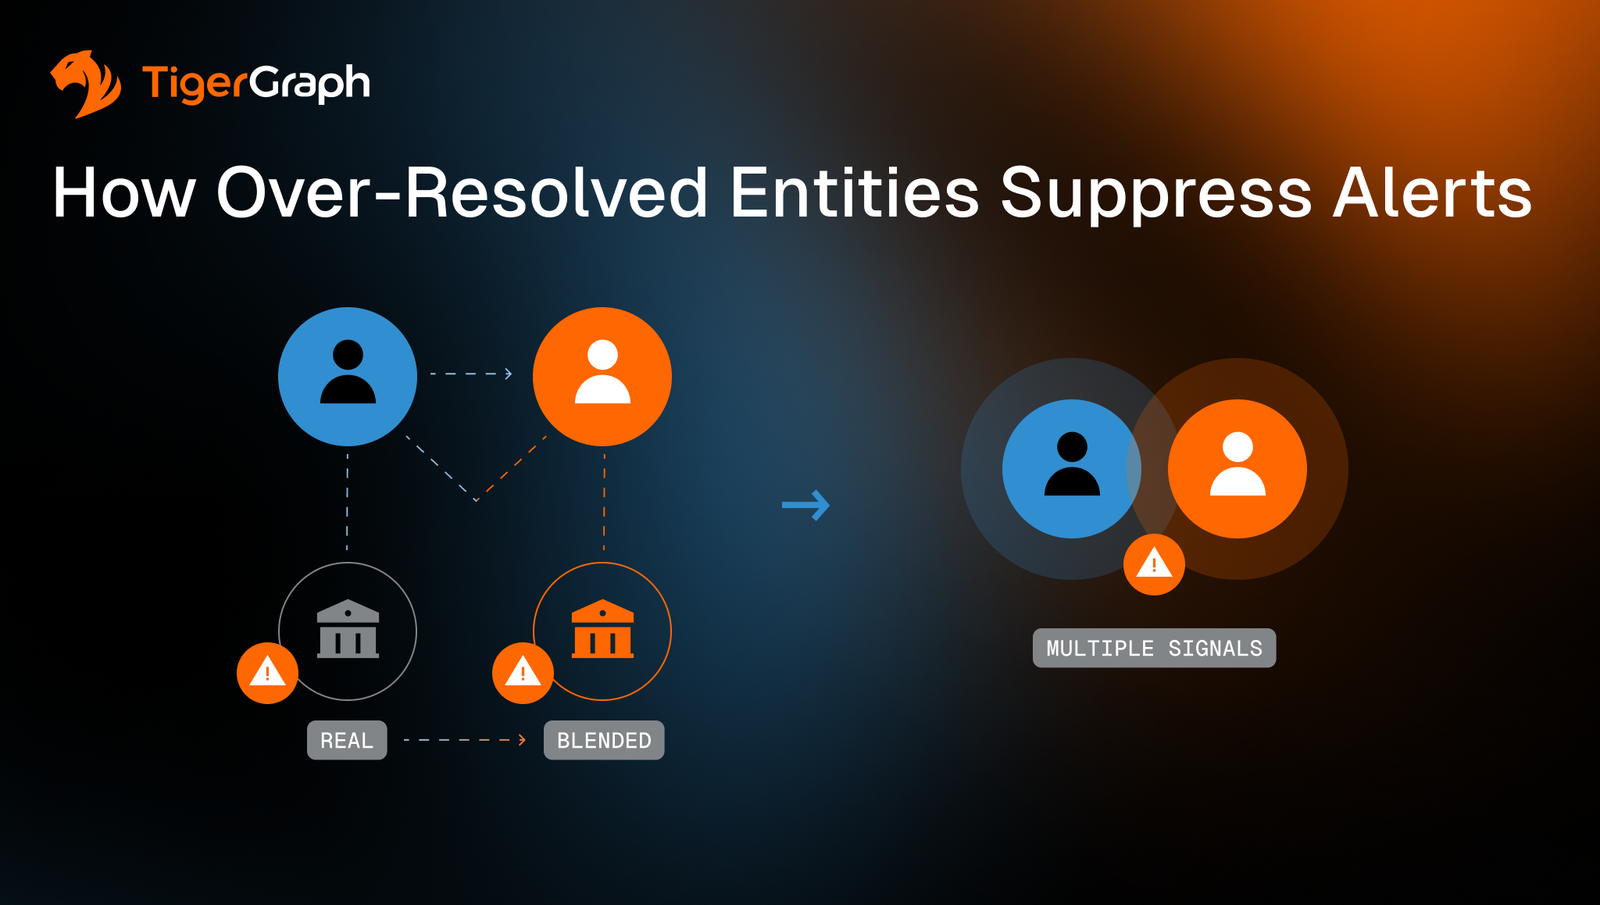
Infographic titled How Over-Resolved Entities Suppress Alerts shows user icons linked to institutions with alert symbols, merging into overlapping circles labeled Multiple Signals. TigerGraph logo is at the top left.
How Over-Resolved Entities Suppress Alerts 
Discover
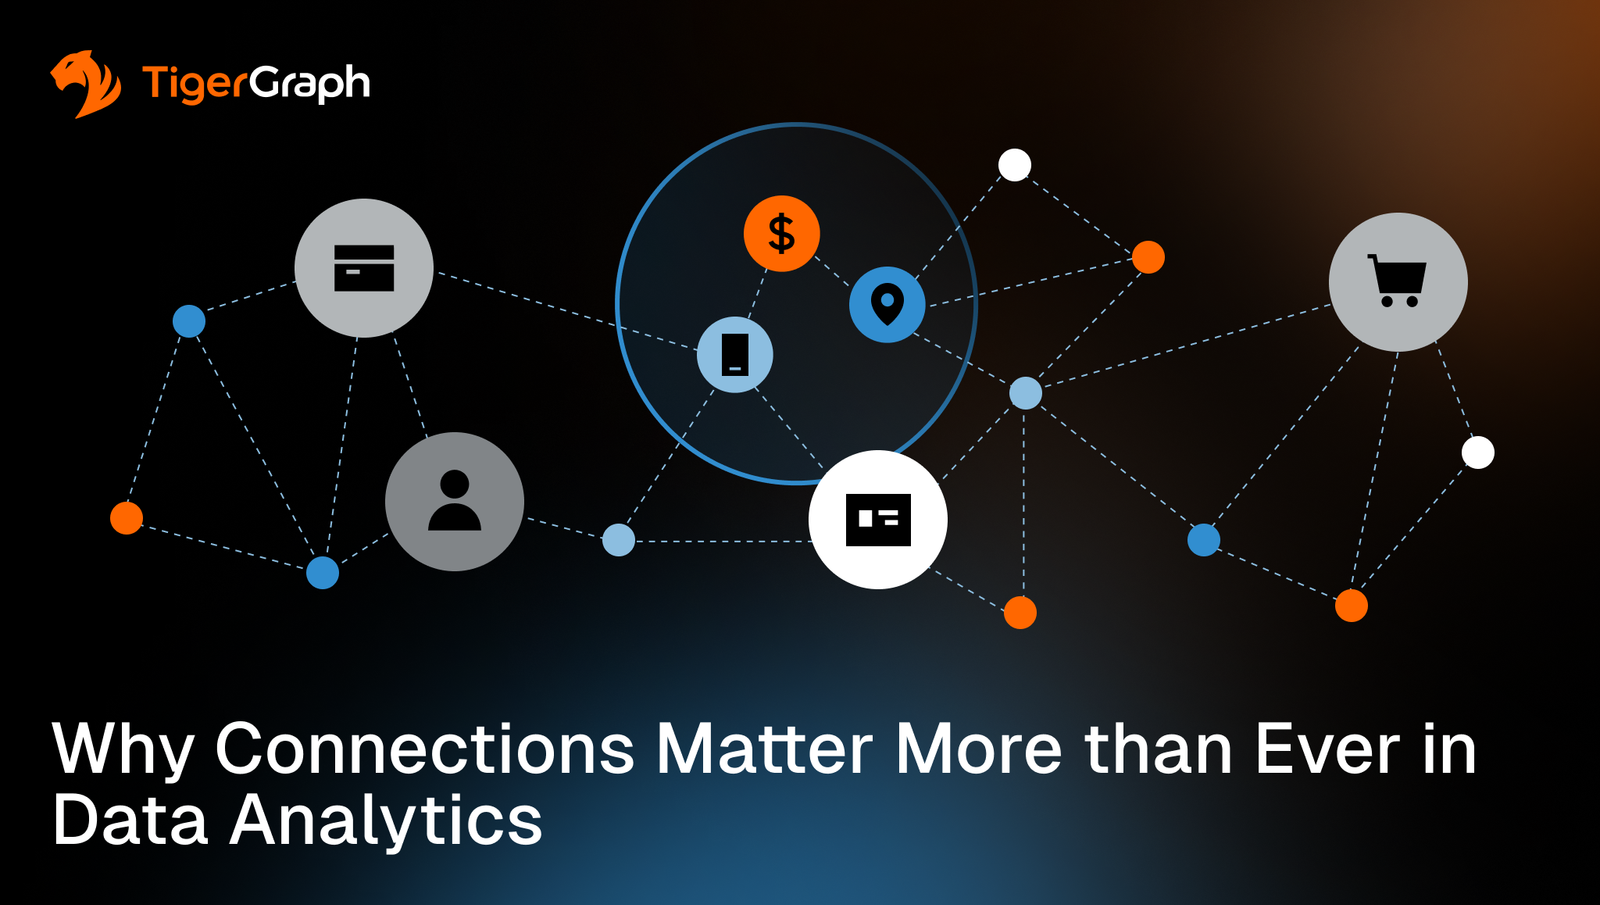
A network diagram with connected icons representing people, devices, money, and shopping, illustrating data relationships. The TigerGraph logo is in the top left, with the text, Why Connections Matter More than Ever in Data Analytics at the bottom.
Why Connections Matter More Than Ever in Data Analytics
Discover
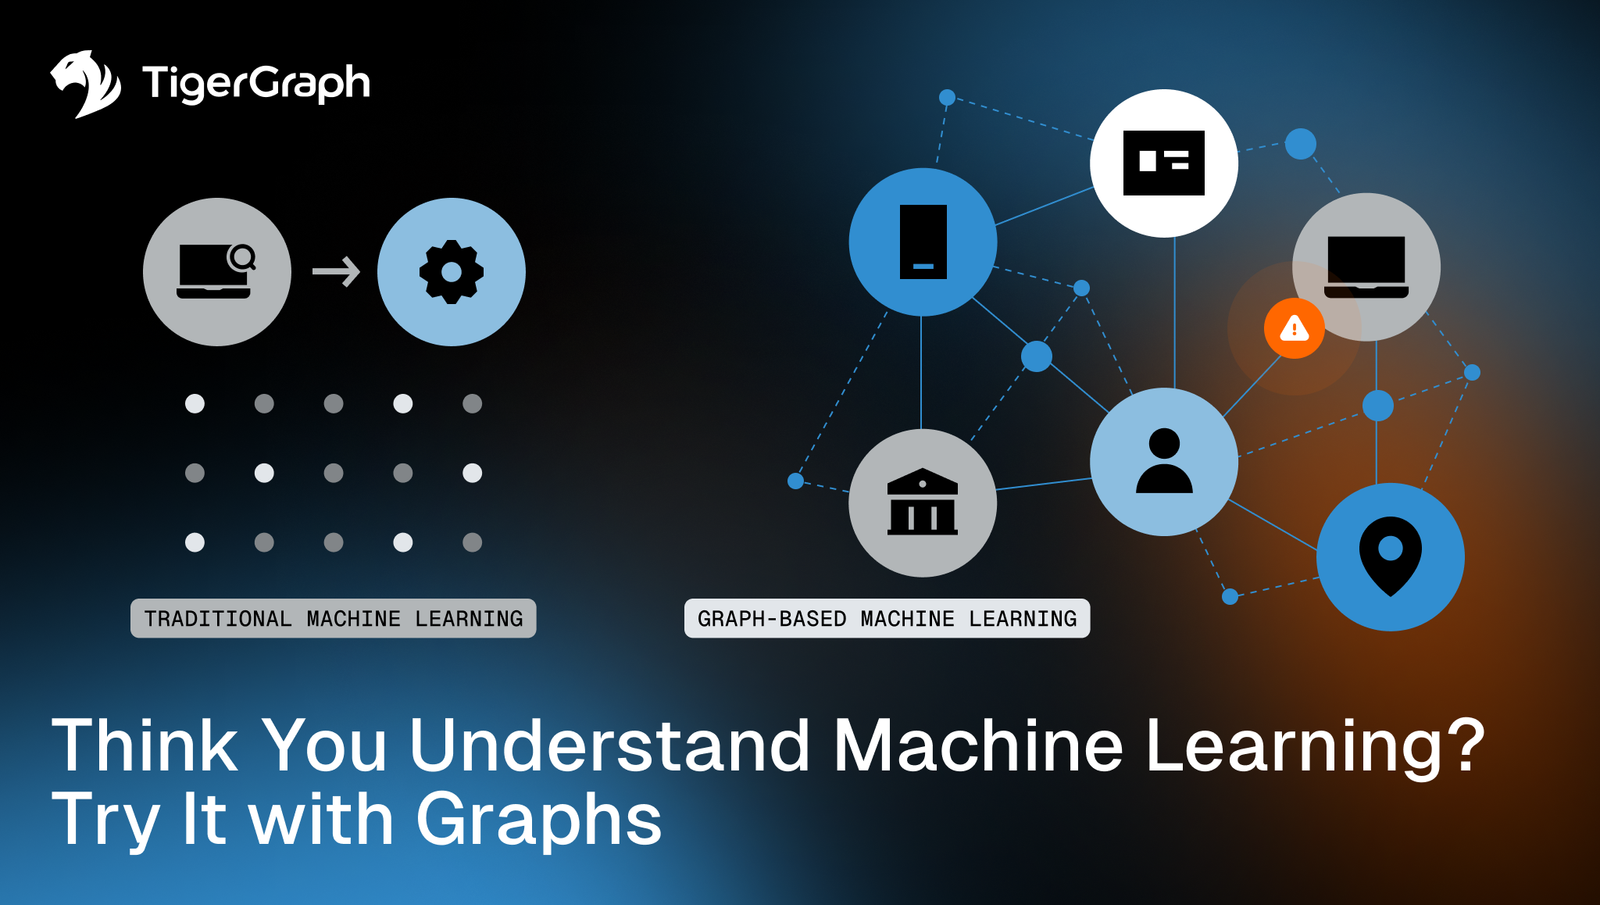
An infographic comparing traditional machine learning, shown with isolated icons, to graph-based machine learning, shown with connected network nodes. Text reads: Think You Understand Machine Learning? Try It with Graphs. TigerGraph logo top left.
Think You Understand Machine Learning? Try it with Graphs
Discover
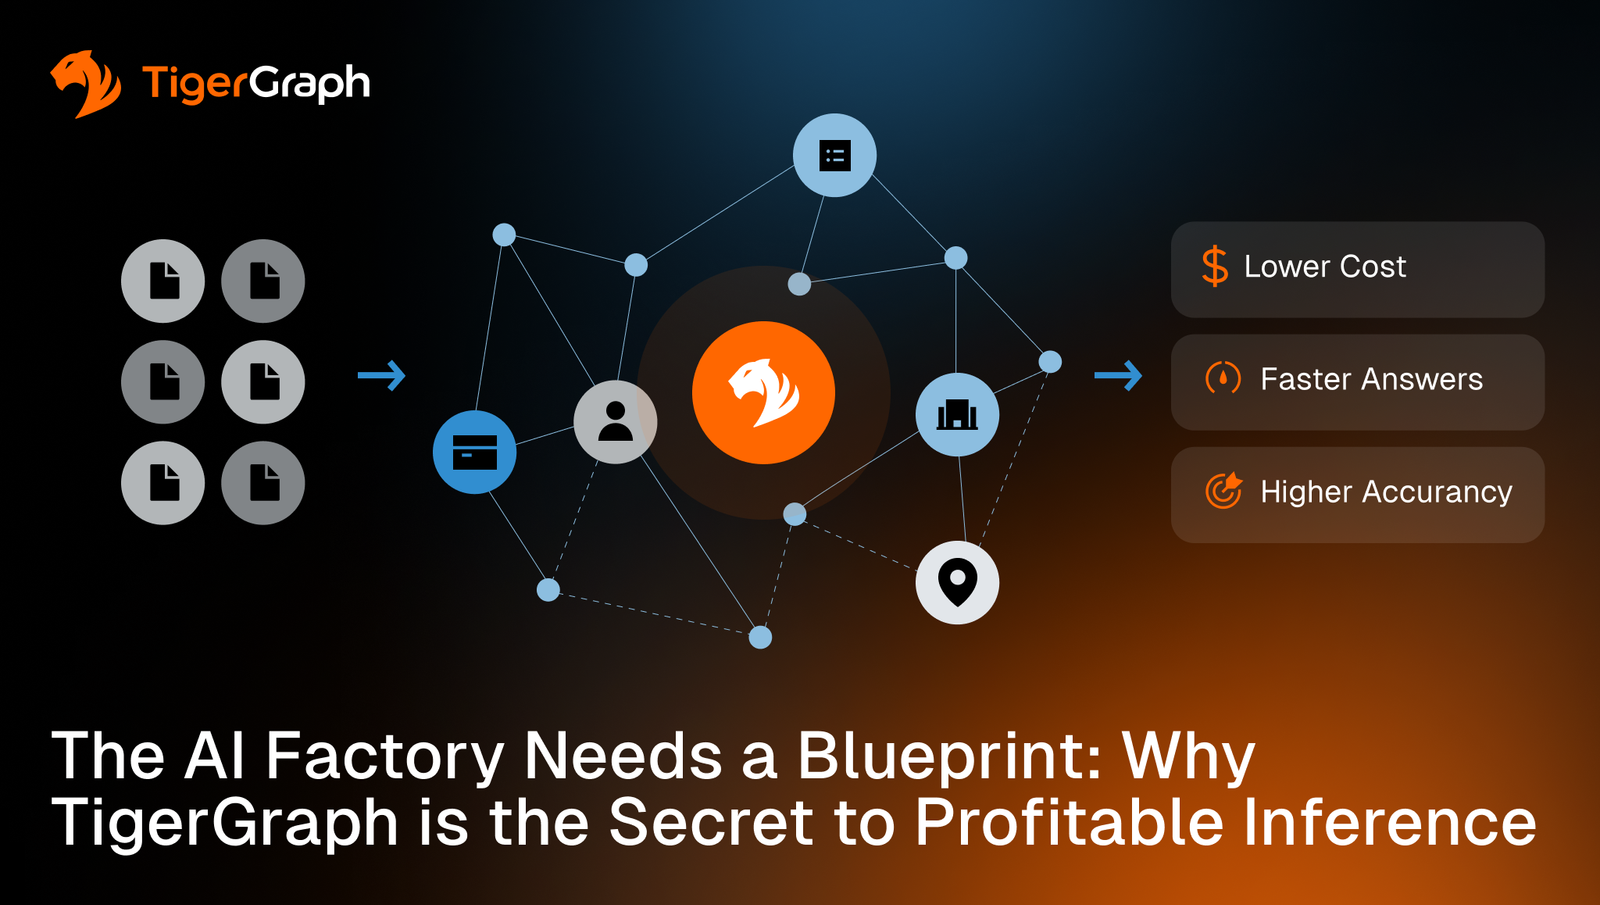
A graphic showing interconnected nodes with the TigerGraph logo at the center. Three benefits—lower cost, faster answers, and higher accuracy—are listed, along with the title: The AI Factory Needs a Blueprint: Why TigerGraph is the Secret to Profitable Inference.
The AI Factory Needs a Blueprint: Why TigerGraph is the Secret to Profitable Inference
Discover
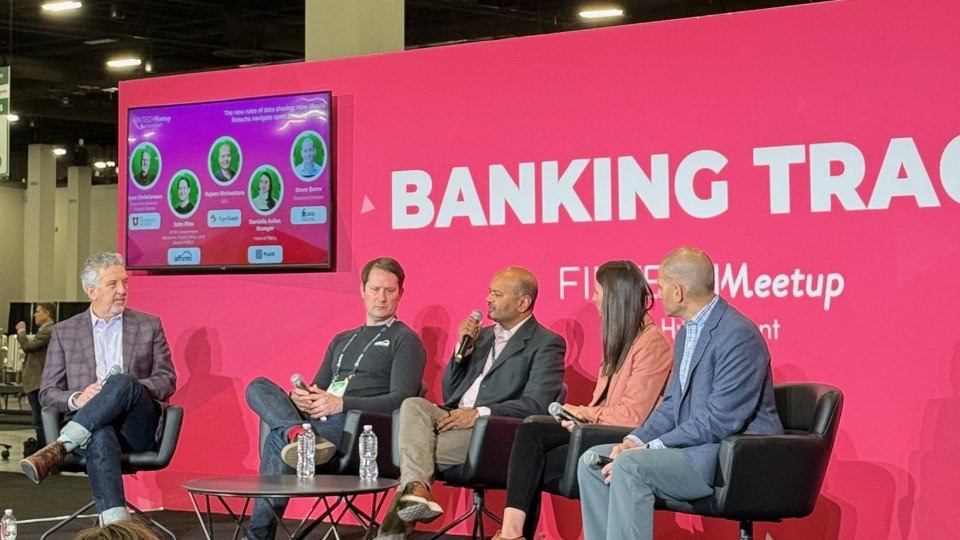
Five people sit on a panel discussing how open banking compliance can be a competitive advantage, on a stage with a bright pink BANKING TRACK backdrop. A screen behind them displays the panel’s topic along with speakers’ names and photos.
From Compliance to Competitive Moat: Takeaways from Fintech Meetup 2026
Discover
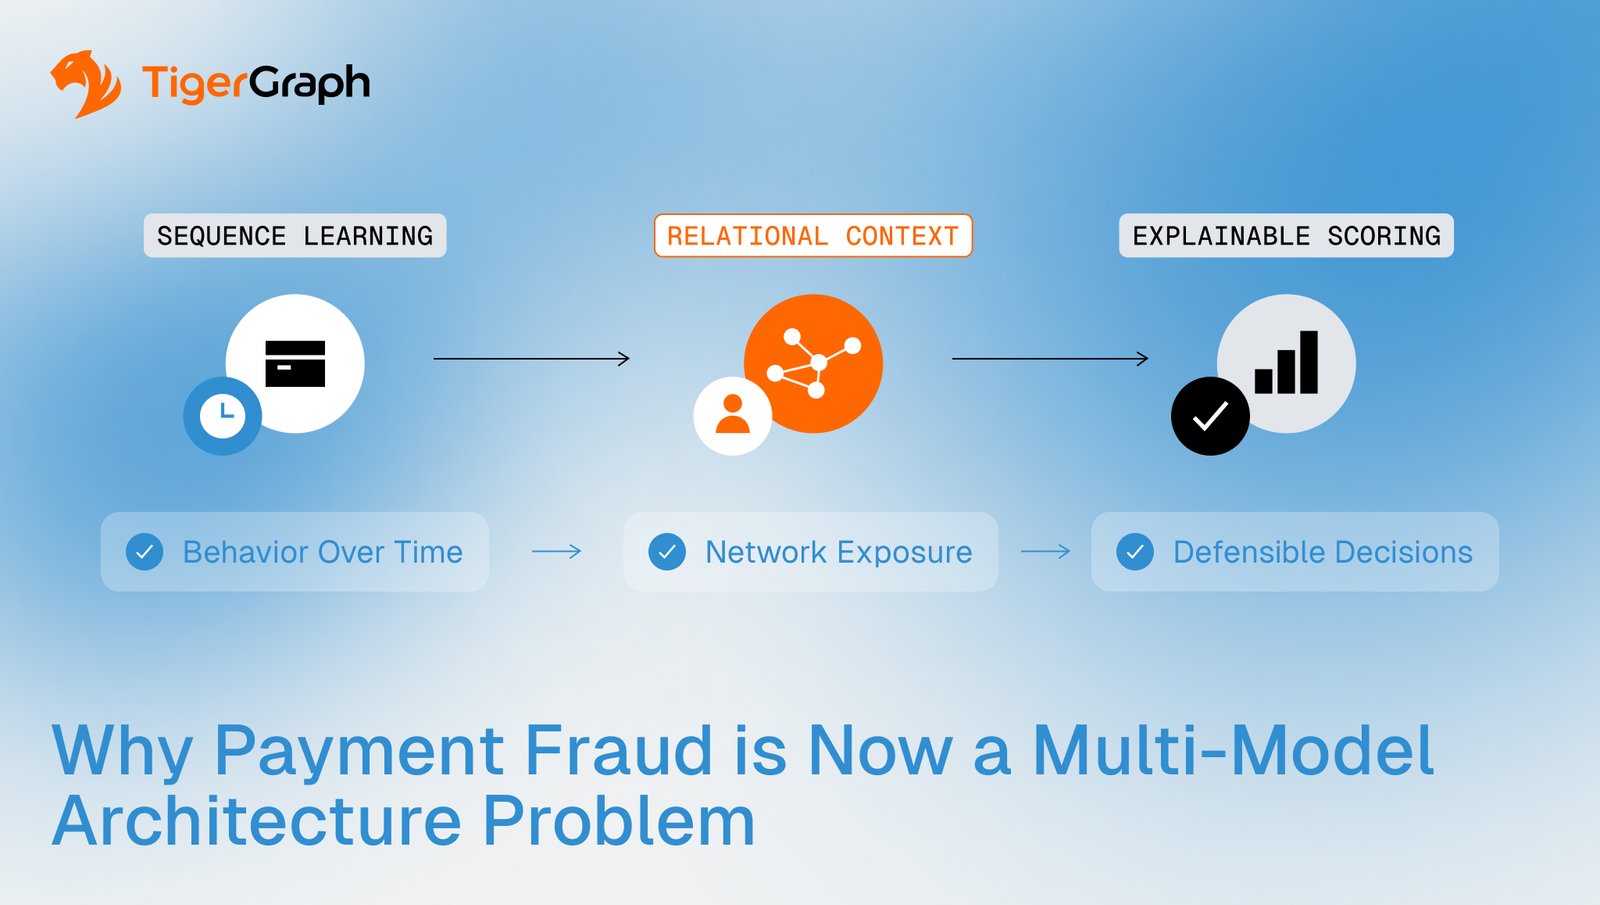
A flowchart by TigerGraph illustrating Why Payment Fraud is Now a Multi-Model Architecture Problem, showing steps: Sequence Learning, Relational Context, and Explainable Scoring, connected to icons and explanatory text.
Why Payment Fraud Is Now a Multi-Model Architecture Problem
Discover
Show More