Contact Us
Back to Blog

Rajeev Shrivastava

CHIEF EXECUTIVE OFFICER

Rajeev brings extensive leadership experience from top technology companies. Previously, he drove significant growth and innovation at Google and NICE inContact, leading major strategic initiatives and successful mergers. His expertise in scaling businesses and fostering innovation is underpinned by an MBA from the Wharton School and a Bachelor’s degree from Delhi College of Engineering. Prior to joining TigerGraph, Rajeev was at Google, where he served as GM & Product Lead for an AI-first Customer Conversation Platform. In this role, he managed a significant P&L and led teams driving innovation and growth within Google’s expansive business landscape. Previously, Rajeev played a pivotal role in the growth of NICE inContact as their Chief Product & Strategy Officer. Prior to NICE inContact, Rajeev led go-to-market and marketplace initiatives at Rackspace.

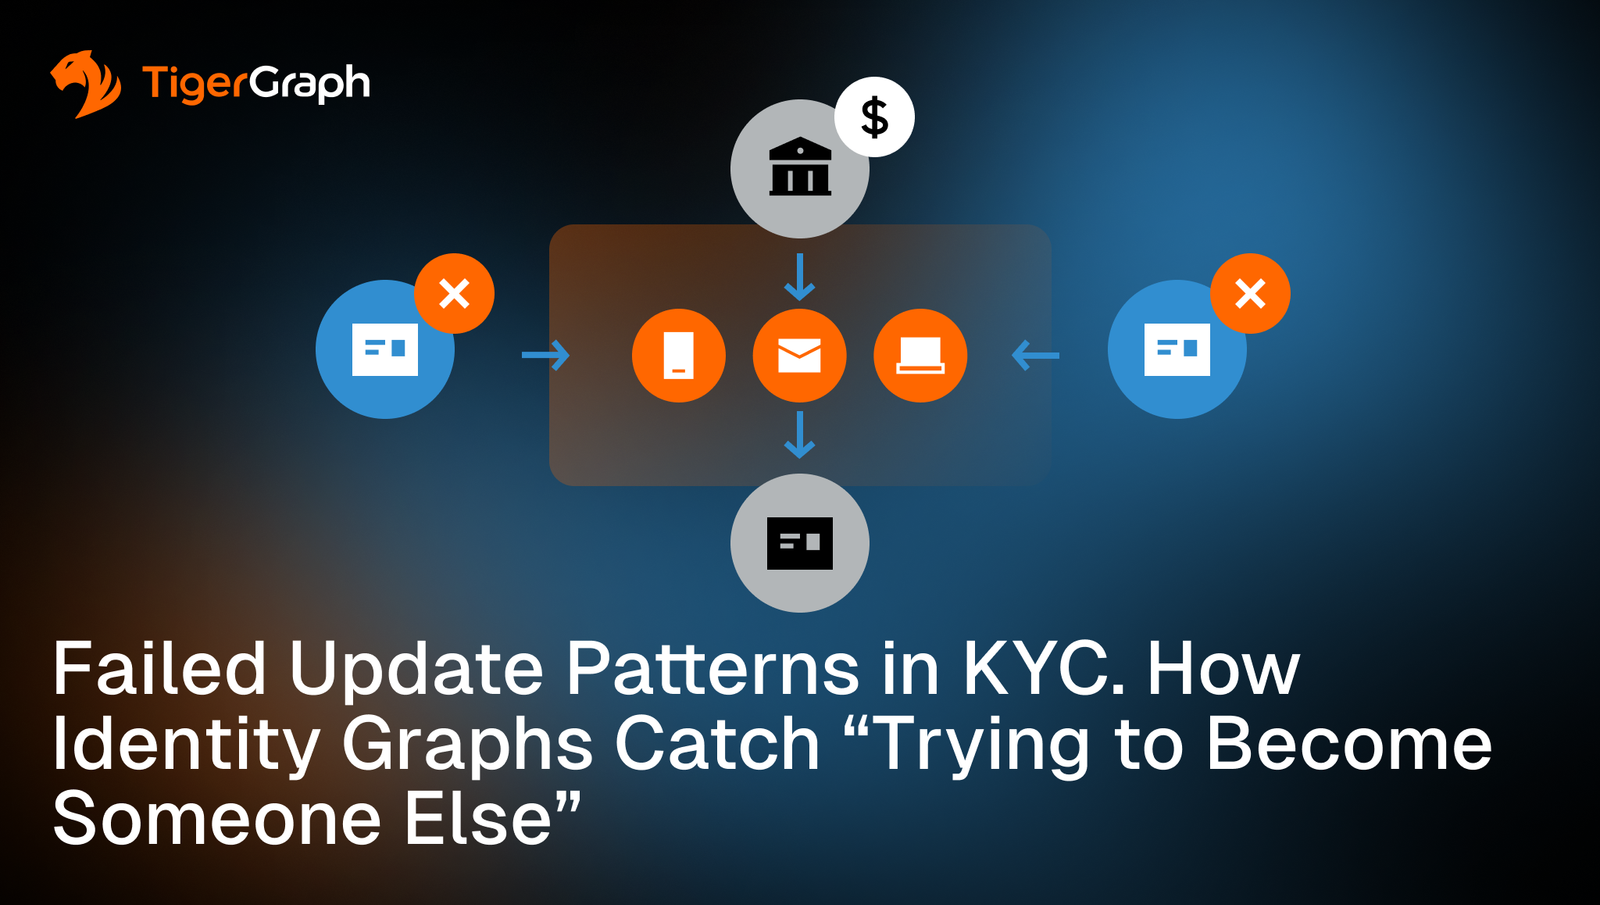
A graphic with icons representing a bank, email, and user profiles, connected by arrows and X marks. The title reads: Failed Update Patterns in KYC. How Identity Graphs Catch Trying to Become Someone Else. TigerGraph logo is in the corner.
Failed Update Patterns in KYC. How Identity Graphs Catch “Trying to Become Someone Else”
Discover
A network diagram illustrating AML graph analytics for structuring and layering detection, with icons of banks, money, and stores connected by dotted lines. The TigerGraph logo and the title are shown at the bottom.
Money Laundering Detection with AML Graph Analytics’ Structuring and Layering 
Discover
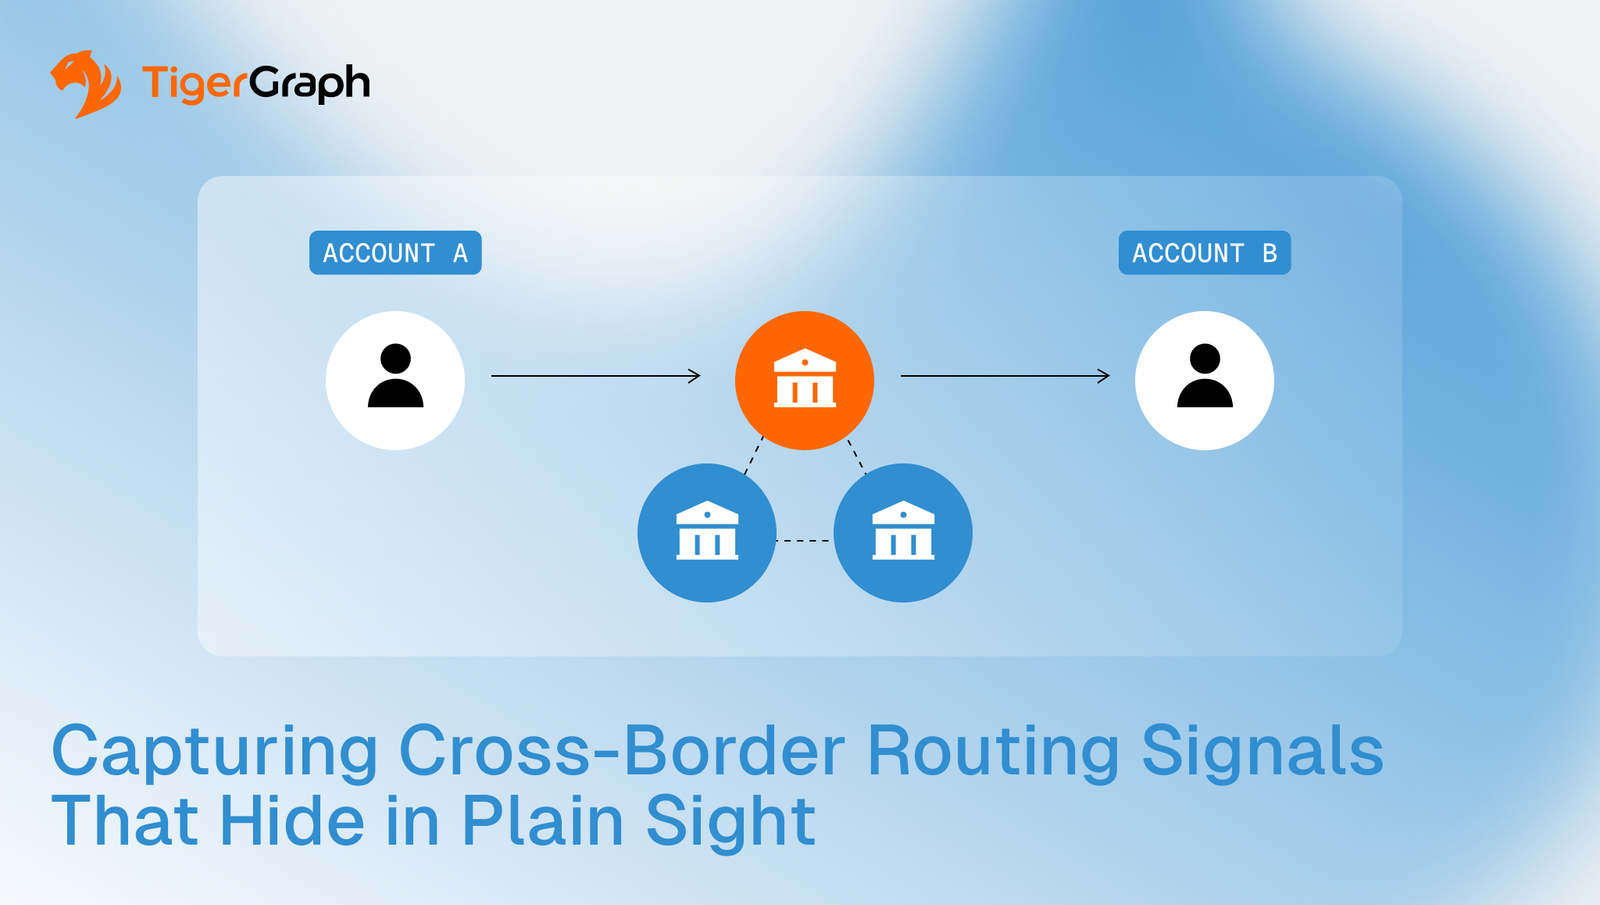
A diagram shows money transfer from Account A to Account B through a central bank icon, with two other banks below. Text: Capturing Cross-Border Routing Signals That Hide in Plain Sight. TigerGraph logo in the top left.
Capturing Cross-Border Routing Signals That Hide in Plain Sight
Discover
A network diagram with icons for people, banks, houses, and locations, illustrating connections. Text reads: How Graph Analysis Finds Repeating Laundering Patterns. TigerGraph logo appears in the top left corner.
How Graph Analysis Finds Repeating Laundering Patterns
Discover
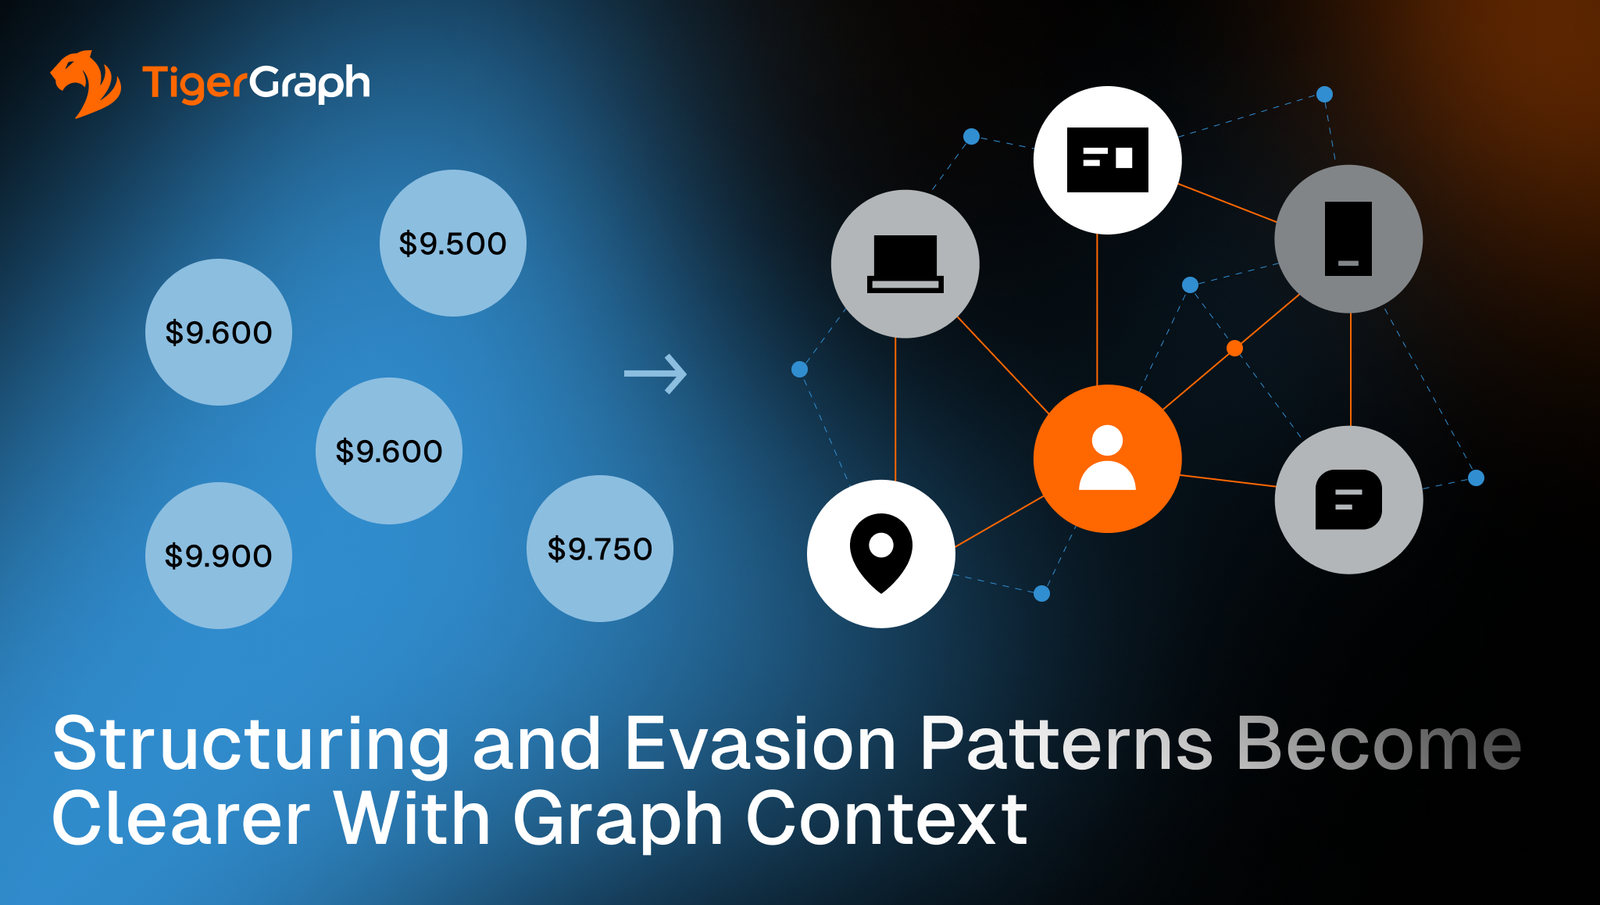
A graphic compares isolated transaction amounts on the left with a connected network of icons (person, devices, location) on the right, illustrating how graph context reveals structuring and evasion patterns. TigerGraph logo is present.
Structuring and Evasion Patterns Become Clearer With Graph Context
Discover
A central orange user icon is connected to smaller nodes, surrounded by six gray icons representing various business concepts. Text reads: High-Impact Graph Database Project Ideas for Modern Data Teams. TigerGraph logo is in the top left.
High-Impact Graph Database Project Ideas for Modern Data Teams
Discover
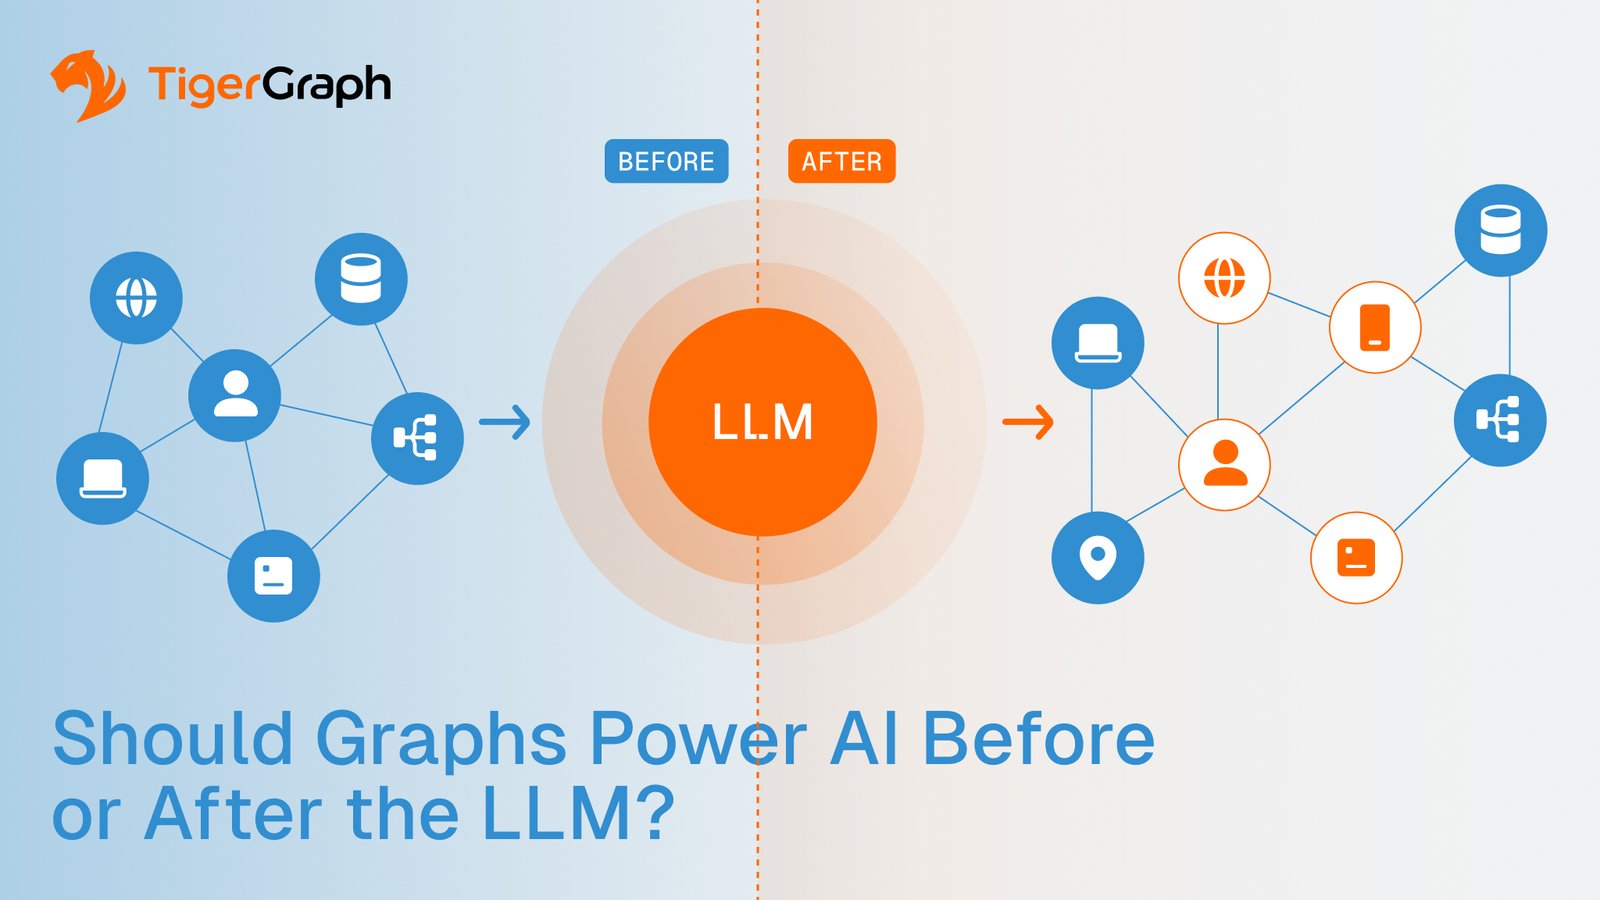
An infographic from TigerGraph shows a comparison: on the left, nodes linked in a network labeled Before point to a central LLM circle; on the right, nodes with icons branch from LLM. Text reads, Should Graphs Power AI Before or After the LLM?.
Should Graphs Power AI Before or After the LLM?
Discover
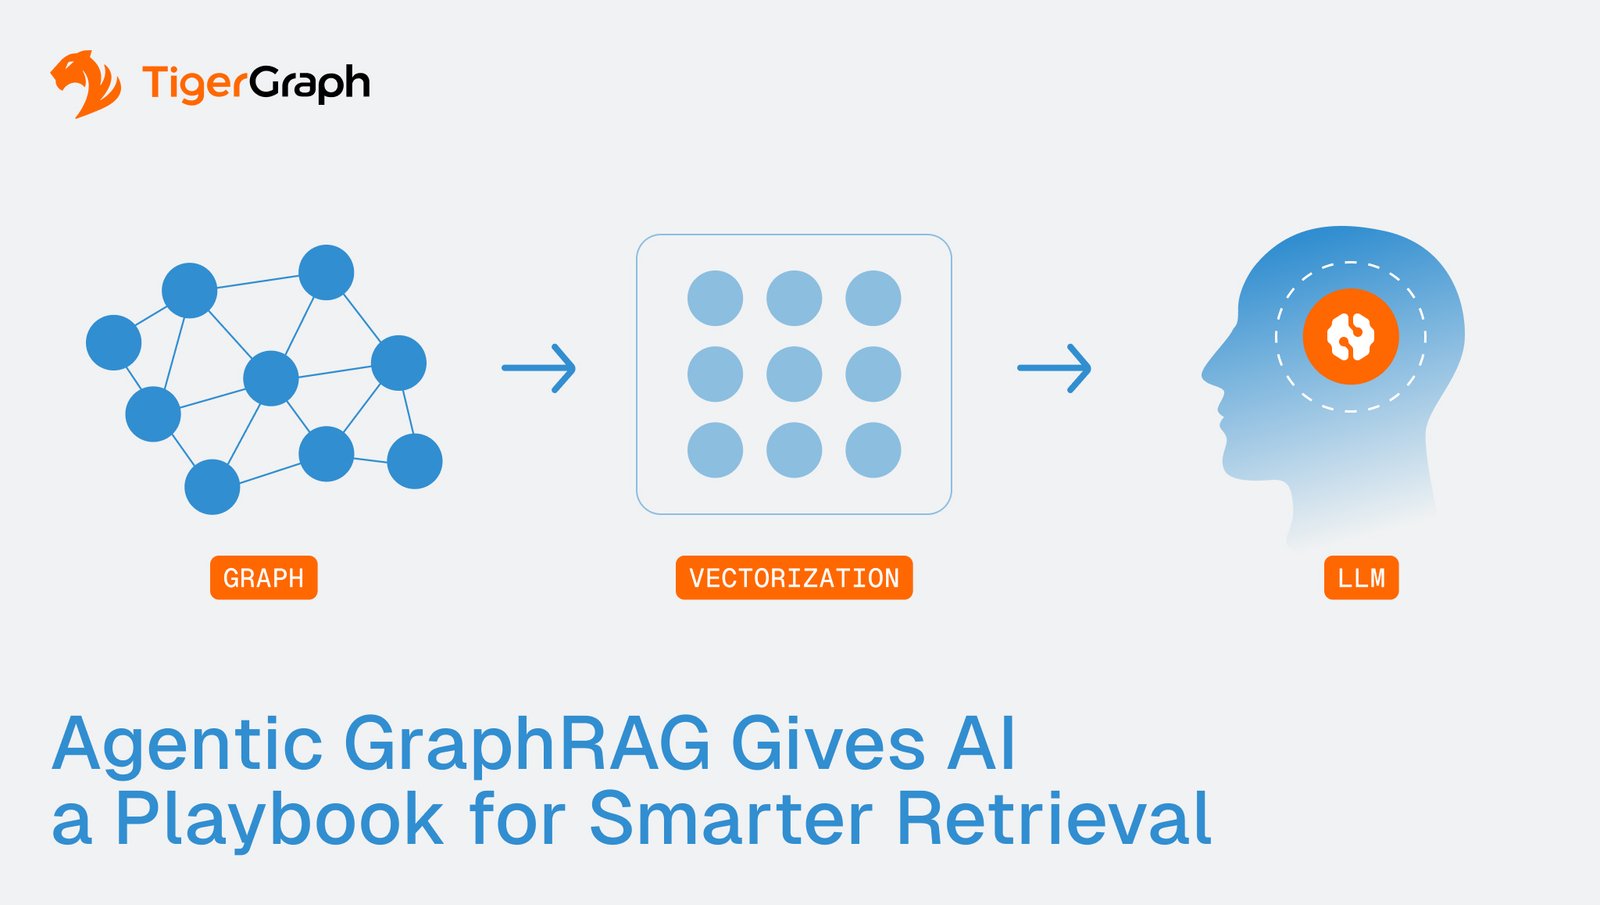
A diagram showing three stages: a connected graph labeled Graph, a grid labeled Vectorization, and a head with a gear labeled LLM. Text below reads, Agentic GraphRAG Gives AI a Playbook for Smarter Retrieval.
Agentic GraphRAG Gives AI a Playbook for Smarter Retrieval
Discover
Show More